Last close As at 05/08/2026
—
— 0.00 (0.00%)
Market capitalisation
—
Research: Investment Companies
Atlantis Japan Growth Fund (AJG) aims to generate long-term capital growth from a diversified portfolio of primarily mid- and small-cap Japanese equities. In 2016, in response to shareholder concerns, which included the trust’s investment performance, the board appointed deputy fund adviser Taeko Setaishi to the position of lead fund adviser. Since then, AJG’s performance has improved. The trust has outperformed its TOPIX benchmark over one, three, five and 10 years, and is the best-performing fund, out of four, in the AIC Japanese Smaller Companies sector over one year. Given the improving economic backdrop in Japan and relatively attractive company valuations, Setaishi is positive on the outlook for Japanese equities and she continues to find interesting growth opportunities across a variety of sectors.
Atlantis Japan Growth Fund |
Improved performance under new lead adviser |
Initiation of coverage |
Investment trusts |
8 February 2018 |
Share price/discount performance
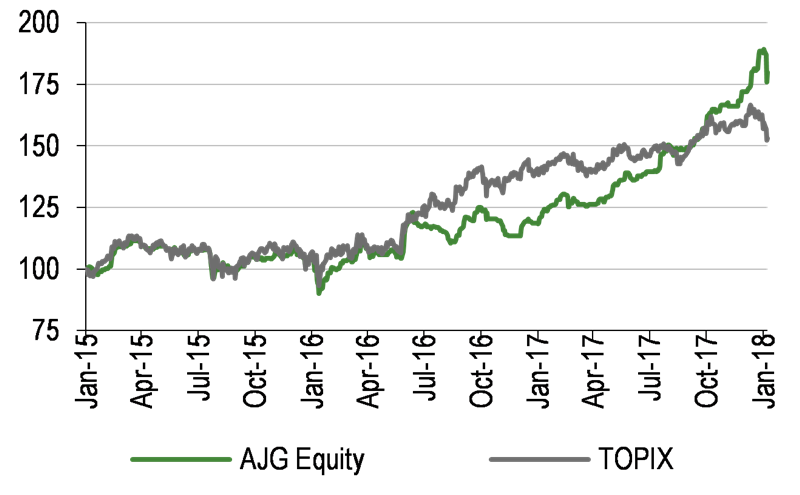
Three-year performance vs index
Gearing
Analysts
|
|||||||||||||||||||||||||||||||||||||||||||||||||||||||||||||||||||||||||||||||||||
Atlantis Japan Growth Fund (AJG) aims to generate long-term capital growth from a diversified portfolio of primarily mid- and small-cap Japanese equities. In 2016, in response to shareholder concerns, which included the trust’s investment performance, the board appointed deputy fund adviser Taeko Setaishi to the position of lead fund adviser. Since then, AJG’s performance has improved. The trust has outperformed its TOPIX benchmark over one, three, five and 10 years, and is the best-performing fund, out of four, in the AIC Japanese Smaller Companies sector over one year. Given the improving economic backdrop in Japan and relatively attractive company valuations, Setaishi is positive on the outlook for Japanese equities and she continues to find interesting growth opportunities across a variety of sectors.
12 months ending |
Share price |
NAV |
TOPIX |
MSCI Japan Small Cap (%) |
MSCI AC |
FTSE All- |
31/01/14 |
27.3 |
29.7 |
14.3 |
17.3 |
9.3 |
10.1 |
31/01/15 |
5.9 |
7.3 |
12.3 |
13.2 |
17.5 |
7.1 |
31/01/16 |
4.8 |
1.6 |
6.0 |
11.0 |
(0.8) |
(4.6) |
31/01/17 |
12.8 |
19.2 |
31.7 |
34.8 |
33.7 |
20.1 |
31/01/18 |
58.7 |
50.4 |
12.5 |
17.0 |
13.4 |
11.3 |
Source: Thomson Datastream. Note: All % on a total return basis in GBP.
Investment strategy: Fundamental stock selection
The investment adviser seeks to identify undervalued growth companies, with clear competitive advantages, that are well managed and generate free cash flow. She follows a disciplined fundamental process, selecting stocks with a mid- to long-term investment horizon. Portfolio construction is unconstrained by the benchmark’s sector and individual company weightings; currently, c 70% of the portfolio is invested in the industrial and technology sectors. Gearing of up to 20% of NAV is permitted and at end-January 2018, net gearing was 4.3%.
Market outlook: Relatively attractive valuations
The economic backdrop in Japan has improved, with a broad-based recovery in exports, investment and household consumption. The consensus view is that this will support continued robust corporate earnings growth. In terms of valuation, Japanese stocks look relatively attractively valued versus those in other developed markets, especially the US. In addition, improving corporate governance, leading to increasing institutional investment allocations, could contribute to a rerating.
Valuation: Discount at the low end of the range
AJG’s shares are currently trading at a 3.0% discount to NAV, which is at the low end of the range of 3.0% to 13.0% over the last 12 months. It is also lower than the averages of the last one, three, five and 10 years (range of 8.4% to 9.9%). The trust has an active discount control mechanism, which includes a continuation vote that will be triggered if its shares have traded, on average, at a greater than 10% discount to NAV during any rolling 90-day period (in normal market conditions).
Exhibit 1: Trust at a glance
Investment objective and fund background |
Recent developments |
|||||||||||||||||||||||||||||||||||||||||||||||||||||||||
Atlantis Japan Growth Fund (AJG) aims to achieve long-term capital growth through investing wholly or mainly in listed Japanese equities. Currently all investments are in Japanese equities with a bias to smaller- and mid-sized companies. |
■ 5 February 2018: Appointment of Michael Moule as independent, non-executive director, with immediate effect. ■ 9 January 2018: Announcement that investment manager Tiburon Partners is to merge with Quaero Capital. ■ 14 December 2017: Six-month results ending 31 October 2017 in £ terms. NAV TR +27.8% versus benchmark TR +12.2%. Share price TR +24.2%. ■ 23 November 2017: Discontinuation of subscription rights approved at EGM. |
|||||||||||||||||||||||||||||||||||||||||||||||||||||||||
Forthcoming |
Capital structure |
Fund details |
||||||||||||||||||||||||||||||||||||||||||||||||||||||||
AGM |
October 2018 |
Ongoing charges |
1.52% (FY17) |
Inv adviser |
Atlantis Investment Research Corp |
|||||||||||||||||||||||||||||||||||||||||||||||||||||
Final results |
July 2018 |
Net gearing |
4.3% |
Inv manager |
Tiburon Partners |
|||||||||||||||||||||||||||||||||||||||||||||||||||||
Year end |
30 April |
Annual mgmt fee |
1.0% |
Address |
16 Charles Street London, W1J 5DS |
|||||||||||||||||||||||||||||||||||||||||||||||||||||
Dividend paid |
Irregular (see page 11) |
Performance fee |
None |
|||||||||||||||||||||||||||||||||||||||||||||||||||||||
Launch date |
10 May 1996 |
Trust life |
Indefinite subject to cont. vote |
Phone |
+44 (0)207 747 5770 |
|||||||||||||||||||||||||||||||||||||||||||||||||||||
Continuation vote |
Conditional on discount |
Loan facilities |
¥1.5bn |
Website |
||||||||||||||||||||||||||||||||||||||||||||||||||||||
Dividend policy and history (financial years) |
Share buyback policy and history (financial years) |
|||||||||||||||||||||||||||||||||||||||||||||||||||||||||
Dividend payments are irregular and paid in US cents. No dividends have been paid since FY12 and there is no intention to make distributions. |
Renewed annually, the board has authority to repurchase up to 14.99% of outstanding shares. Allotments are exercises of subscription rights. |
|||||||||||||||||||||||||||||||||||||||||||||||||||||||||
|
|
|||||||||||||||||||||||||||||||||||||||||||||||||||||||||
Shareholder base (as at 29 January 2018) |
Portfolio exposure by market cap (rebased for gearing, as at 31 Jan 2018) |
|||||||||||||||||||||||||||||||||||||||||||||||||||||||||
|
|
|||||||||||||||||||||||||||||||||||||||||||||||||||||||||
Top 10 holdings (as at 31 January 2018) |
||||||||||||||||||||||||||||||||||||||||||||||||||||||||||
|
||||||||||||||||||||||||||||||||||||||||||||||||||||||||||
Source: Atlantis Japan Growth Fund, Edison Investment Research, Bloomberg, Morningstar. Note: *N/A where not in January 2017 top 10.
Market outlook: Relatively attractive valuations
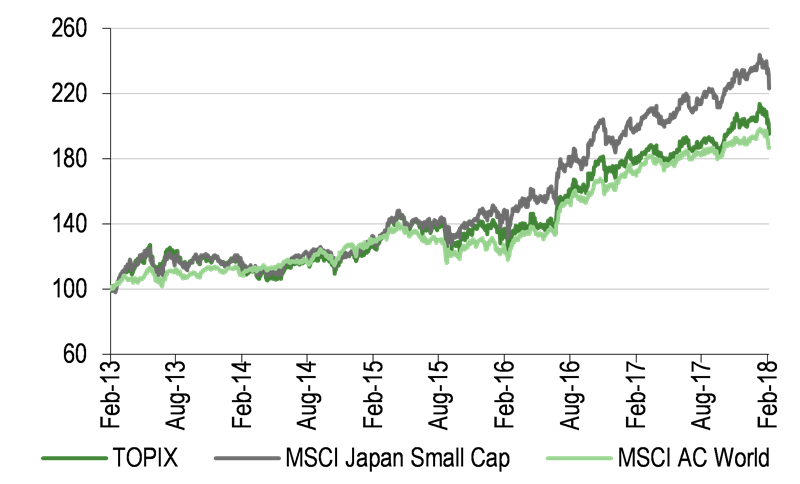
Exhibit 2 (LHS) shows the performance of indices over the last five years in sterling terms. Over this period, both large- and small-cap Japanese equities have outperformed global equities, with small-cap stocks showing meaningful outperformance (c 35pp). Japanese equities have been particularly strong since September 2017, following the snap general election, as investors have renewed confidence that Prime Minister Abe’s supportive monetary and economic policies will be maintained until 2021.
|
Exhibit 2: Market performance and valuation |
|
Performance of indices (last five years, in £ terms) |
Japan forward P/E multiple and discount to World index |
|
|
|
Source: Thomson Datastream, Edison Investment Research |
|
Japanese equities remain relatively attractively valued. On a forward P/E multiple basis, Japan is currently trading at a 1.1% discount to world equities, which is modestly wider than the 0.6% average discount of the last five years (Exhibit 2, RHS). While developed markets equities are trading above their 10-year average forward P/E multiples across the board (Exhibit 3), Japanese equities are only 7% above average, which compares with world and US equities at 19% and 22% above average respectively. In absolute terms, Japanese equities are trading at a meaningful 34% discount to the high end of the forward P/E multiple 10-year range, whereas world and US equities are trading close to the top end of their 10-year ranges.
Exhibit 3: Forward P/E multiples of Datastream indices (last 10 years)
(x) |
Last |
High |
Low |
10-year average |
Last as % of average |
Japan |
15.5 |
23.6 |
10.5 |
14.4 |
107 |
US |
18.0 |
18.9 |
9.4 |
14.7 |
122 |
UK |
14.0 |
15.7 |
7.4 |
12.2 |
115 |
Europe |
14.2 |
15.6 |
7.6 |
11.8 |
120 |
World |
15.7 |
16.1 |
8.9 |
13.2 |
119 |
Source: Thomson Datastream, Edison Investment Research. Note: Data at 6 February 2018.
Japanese economic data continue to improve, which should translate into further positive Japanese equity performance, due to higher corporate earnings. Improving economic conditions are apparent at both the corporate and the consumer level. Exhibit 4 shows that Japanese consumer confidence and willingness to purchase consumer durable items continue their solid uptrends. Inflation expectations have also been in an uptrend since early 2014 (Exhibit 5), although they have stabilised recently. The International Monetary Fund (IMF) has recently increased its GDP growth projections for Japan. In the January 2018 update of its World Economic Outlook, the IMF’s Japanese growth forecasts were revised up by 0.5pp to 1.2% for 2018 and by 0.1pp to 0.9% for 2019. Reasons cited were higher external demand, carryover from recent stronger-than-expected economic activity and the supplementary budget for 2018. In December 2017, Prime Minister Abe’s cabinet approved a ¥97.7tn draft budget for fiscal 2018 (ending 31 March 2019) to fund rising social security and defence costs. The size of the budget was a new record for the sixth consecutive year.
|
Exhibit 4: Consumer confidence, willingness to buy |
Exhibit 5: % of respondents expecting prices to rise |
|
|
|
Source: Thomson Datastream, Edison Investment Research |
|
Exhibit 4: Consumer confidence, willingness to buy |
|
|
Source: Thomson Datastream, Edison Investment Research |
|
Exhibit 5: % of respondents expecting prices to rise |
|
|
Source: Thomson Datastream, Edison Investment Research |
While Japan has experienced its share of economic challenges in recent years, there is now evidence of a broad-based improvement in the Japanese economy. There are tight conditions in the corporate sector, both in terms of capacity and labour, and higher household demand. Against this positive backdrop, the Japanese stock market is relatively attractively valued versus other developed markets, suggesting scope for an element of re-rating to push the market higher, as well as earnings growth. For investors seeking exposure to the country, a single-country fund with a disciplined investment approach and an improving performance record versus its benchmark may be of interest.
Fund profile: Primarily small- and mid-cap companies
AJG was launched on 10 May 1996 and is traded on the Main Market of the London Stock Exchange. The trust’s investment fund manager is Tiburon Partners (since 2012), with Atlantis Investment Research Corporation (AIRC) acting as investment adviser. AIRC is a Tokyo-based independent boutique fund adviser, established in 1996. It has a team of four investment professionals, with average Japanese investment experience of more than 30 years (three portfolio advisers supported by an analyst). AJG’s lead adviser since 1 May 2016 is Taeko Setaishi. Setaishi was formerly AJG’s deputy fund adviser to Ed Merner, since joining AIRC in 1996. On 9 January 2018 Tiburon Partners announced that it would be joining forces with Geneva-based specialist asset manager Quaero Capital. At the date of this report, the deal remains subject to FCA and FINMA approvals. It is hoped that the tie-up will be completed in Q118, and following completion, Tiburon Partners will be renamed Quaero Capital. There will be no personnel changes in the team responsible for AJG.
The trust’s objective is to generate long-term capital growth from a diversified portfolio of primarily small- and mid-cap Japanese equities. Up to 100% of gross assets may be invested in companies quoted on any Japanese stock exchange, a maximum 20% of NAV may be invested in companies listed on other stock exchanges, which are managed from Japan or have material exposure in the country, and up to 10% of NAV may be held in unlisted companies. A maximum 20% of NAV, at the time of investment, may be allocated to equity warrants or convertible debt. However, AJG’s current portfolio is entirely invested in publicly listed Japanese companies (including REITs); it has no structured product exposure. No more than 10% of the portfolio may be held in a single company. At end-January 2018, AJG held 70 stocks, with the relatively large number of holdings considered to diversify risk. Gearing of up to 20% of NAV is permitted at the time of borrowing: at end-January 2018, net gearing was 4.3%. The trust does not typically hedge its currency exposure.
Shareholder activism
On 17 March 2016, LIM Advisors (LIM), which was then AJG’s largest shareholder, sent the board a requisition to consider a restructuring or liquidation of the trust, as they believed the board had not addressed their concerns about AJG. These included investment performance, the size of the fund and the discount to NAV. On 18 April 2016, LIM published an open letter to shareholders proposing an EGM to enable them to exit their holdings at a price close to NAV or to roll-over their investment to the better-performing open-ended sister fund, Atlantis Japan Opportunities Fund, managed by Setaishi. The EGM was held on 3 May 2016, with 75% of shareholders casting their votes, and only 43.73% voting in favour of LIM’s resolution, which therefore was not passed.
As shown in Exhibit 10, following the appointment of Setaishi as lead adviser in May 2016, there was an initial period of underperformance versus the benchmark. This was attributed to the relative strength of cyclical, lower-quality stocks, which are under-represented in AJG’s portfolio, and also due to a large-scale Exchange Traded Funds purchase programme by the Bank of Japan and The Japanese Government Investment Pension Fund, which boosted the performance of large-cap stocks. Since the latter part of 2016, the trust has enjoyed a sustained period of outperformance and from mid-December 2016 to end-January 2018, AJG outperformed the benchmark by c 35pp.
The fund’s lead adviser: Taeko Setaishi
The adviser’s view: Positive outlook for Japanese equities
Despite the strong performance of Japanese equities in 2017, lead adviser Setaishi is encouraged by the outlook for the Japanese stock market in 2018. This is based on the expectation of continued growth in both corporate sales and earnings, and attractive equity valuations. She believes that the economic environment is positive; Japan is enjoying its ninth consecutive quarter of economic expansion, with growth well balanced between exports, household consumption and corporate investment. The consensus outlook is for real growth of 1.5% for the 12 months to end-March 2018, and between 1.0% and 1.5% for the following 12 months. An increase in corporate spending is being driven by tightness in capacity (Japanese companies are able to fund their required capex from internally generated cash flow), and also due to a tight labour market. Setaishi notes that the strength of Japanese capital goods companies may be under appreciated by investors; she says that Japan’s inventors lead the world in the number of patent filings. Another key driver of economic improvement has been higher household spending. In addition, Japan is experiencing an economic boost from an increase in tourism with inbound arrivals growing at an annual rate of 15-20%, which is driving demand in the retail and services sectors.
Regarding equity valuations, the adviser emphasises that AJG’s investment process primarily focuses on growth rather than value and she says that there are a large number of growth opportunities in Japan. Looking at the Japanese stock market as a whole, it is currently trading on a forward earnings multiple of c 16x, which is a discount to world equities and meaningfully cheaper than US equities. Setaishi suggests that investors have underappreciated the earnings potential of Japanese companies and believes that, in aggregate, valuations on both forward earnings and price-to-book multiples remain compelling. During 2017, there was a pronounced bias towards growth rather than value stocks, which the adviser expects to continue in 2018.
Setaishi believes that corporate profit growth will continue to be led by the machinery, electrical and service sectors. The service sector is made up of a wide array of businesses and is an area where many new business models have been established. Structural changes in the Japanese economy include outsourcing of non-core operations, such as searching for key personnel ie engineers, due to the tight labour market. There is also increasing demand for companies offering care services for both children and the elderly.
Improving corporate governance is a key development in Japan. The Governance Corporate Code was introduced in June 2015 and this has led to more productive and profitable companies. The adviser has ongoing discussions with company managements regarding their progress, although a company’s corporate governance record is only a small part of her investment decision. Some of the larger companies in Japan have defined metrics that they try to achieve, such as a return on equity target, while in general, smaller companies are less strict, but are definitely trying to improve their corporate governance performance. While Japanese companies are increasingly returning excess capital to shareholders in the form of dividends and share repurchases, there is also a higher awareness of companies’ social and environmental responsibilities. This is more prevalent at smaller companies in Japan, where senior management teams tend to be younger.
Overseas investors historically account for c 70% of the turnover on the Tokyo Stock Exchange and their level of interest fluctuates noticeably over time. Setaishi believes that there is potential for positive fund flows into Japan, based on relatively attractive valuations and overseas investors’ underweight allocations to the country. She notes that the negative correlation between the performance of TOPIX and the yen has broken down, which implies that Japanese stocks should trade more on company fundamentals, which are favourable, rather than speculation on the Japanese currency. Setaishi also suggests that improving corporate governance practice and Japan’s political stability may be attractive attributes for international investors.
Asset allocation
Investment process: Bottom-up stock selection
The AIRC team believes that company earnings drive long-term share price performance. It targets undervalued growth companies, seeking well-managed firms, with clear competitive advantages that can generate strong free cash flow. Research is proprietary: stocks are selected on a bottom-up basis, with a mid- to long-term investment horizon. Company meetings are a key element of the investment process, and number c 800 per annum.
AIRC’s investment process can be broken down as follows:
■
Periodic screening – screens on a universe of c 2,000 companies are run on a quarterly basis. Criteria include sales and operating profit growth of 10% or higher, improving operating margins, improving return on equity and valuation multiples such as price-to-book relative to the sector, P/E-to-growth (PEG) and EV/EBITDA.
■
Company visits – these are viewed by AIRC as a critical element to the investment process, to enable an understanding of a company’s business model, strengths/weaknesses and future strategy. Meetings with a company’s competitors and suppliers can reinforce the team’s belief in a firm’s growth potential. These meetings are also able to highlight further companies worthy of fundamental research that are not identified in the screening process.
■
Evaluation – fundamental research assessing long-term sales and earnings growth potential by construction of an earnings growth model.
■
Buy list – typically c 125 companies that may be considered for inclusion in the portfolio. The team has weekly meetings to discuss any updates on companies on the buy list and any new information gleaned from other company meetings. Following discussions, companies are either: added to/kept on the buy list; eliminated from the buy list; or added to/kept on a watch list of c 40 companies with attractive fundamentals, but unappealing valuations.
■
Portfolio construction – AIRC recommends buy list stocks to be included in AJG’s portfolio.
■
Sell discipline – stocks may be sold if there is a downturn in a company’s operating environment, following an earnings disappointment, if there is a perceived unjustified change in the business model or if a portfolio position becomes too large.
AJG’s resulting portfolio is diversified and has a bias towards small- and mid-cap companies. It typically has 50-70 holdings, with the largest positions making up 3% to 4% of the portfolio. If a position increases to 5% of the portfolio, it will usually be reduced. New positions are typically 0.5%, which may be increased to 1% and then 2% if the adviser has a good degree of conviction and there is adequate trading liquidity in the shares. The trust has a high active share, currently 97% (active share is a measure of how a portfolio differs from the benchmark, with 100% representing no commonality and 0% full index replication).
The adviser believes that frequent contact with the managements of investee companies is an effective way of managing portfolio risk. In terms of share liquidity, at end-FY17, based on one third of the last three months’ average daily volume, 95.9% of AJG’s portfolio could be realised within two weeks, with the 4.1% balance realised between two weeks and one month. Portfolio turnover has reduced from an annual rate of 75% now that Setaishi has restructured AJG’s portfolio. The historical range is 30% to 70% pa, depending on market conditions. In 2016 and 2017, the exercise of subscription rights added to the level of portfolio turnover.
Current portfolio positioning
As shown in Exhibit 6, the majority of AJG’s portfolio is held in mid- and small-cap stocks. At the end of January 2018, c 80% of the portfolio was made up of companies with a market cap of less than $5bn. Over the last 12 months, the largest changes in capitalisation exposure were a 13.6pp increase in companies with a market cap between $500m and $2bn and an 11.5pp reduction in companies with a market cap between $2bn and $5bn.
Exhibit 6: Portfolio exposure by market cap (% unless stated)
Portfolio end-January 2018 |
Portfolio end-January 2017 |
Change (pp) |
|
>$10bn |
13.1 |
14.4 |
(1.3) |
$5bn to $10bn |
7.3 |
1.0 |
6.3 |
$2bn to $5bn |
8.9 |
20.4 |
(11.5) |
$500m to $2bn |
39.6 |
26.0 |
13.6 |
<$500m |
31.1 |
38.1 |
(7.1) |
100.0 |
100.0 |
Source: Atlantis Japan Growth Fund, Edison Investment Research. Note: Rebased for gearing.
Exhibit 7 shows AJG’s sector exposure, which uses Global Industry Classification Standard (GICS) rather than TOPIX classifications. Over the 12 months to end-January 2018, the largest increase in exposure was industrials (+15.3pp), while the largest decreases were financials (-11.1pp) and materials (-4.9pp). Versus the benchmark, the major overweight exposures are industrials and technology (both c 2.0x weighted), with underweight positions in telecoms, financials, materials and consumer discretionary. Illustrating the unconstrained nature of AJG’s investment approach, the trust has no exposure in the consumer staples, energy and utility sectors.
While the adviser makes stock decisions on a bottom-up basis, with no specific sector allocations, there are several key long-term investment themes within AJG’s portfolio. These include:
■
Factory automation – Japan holds a leading global position in the provision of robots and material handling systems to manufacturers and logistics operators. Examples in AJG’s portfolio include top 10 position Daifuku (material handling) and Keyence (sensors).
■
Healthcare – due to the aging population in Japan, there is increasing demand for healthcare, both in terms of products and services. AJG’s holdings in the sector include top 10 position Asahi Intecc (medical devices), Cyberdyne (robotics), PeptiDream (drug discovery) and Solasto (healthcare services).
■
Outsourcing – due to tight labour conditions, companies are increasingly outsourcing non-core operations. One of AJG’s holdings is Benefit One, which administers welfare and employee benefit programmes for both public and private companies.
■
Semiconductor equipment – ongoing technological developments will support continued demand for semiconductor equipment. One of AJG’s positions is Tokyo Electron, which is a supplier of equipment to fabricate integrated circuits, flat panel displays, and photovoltaic cells.
Exhibit 7: Portfolio sector exposure vs benchmark (% unless stated)
Portfolio end- |
Portfolio end- |
Change |
Index |
Active weight |
Trust weight/ |
|
Industrials |
47.4 |
32.1 |
15.3 |
23.0 |
24.4 |
2.1 |
Information technology |
23.5 |
23.8 |
(0.3) |
12.6 |
10.9 |
1.9 |
Consumer discretionary |
11.2 |
15.2 |
(3.9) |
19.6 |
(8.3) |
0.6 |
Healthcare |
6.4 |
4.9 |
1.6 |
6.6 |
(0.2) |
1.0 |
Real estate |
5.7 |
0.0 |
5.7 |
3.1 |
2.5 |
1.8 |
Materials |
3.9 |
8.8 |
(4.9) |
7.4 |
(3.5) |
0.5 |
Financials |
1.2 |
12.4 |
(11.1) |
12.2 |
(10.9) |
0.1 |
Telecommunications |
0.6 |
0.0 |
0.6 |
4.6 |
(4.0) |
0.1 |
Energy |
0.0 |
0.0 |
0.0 |
1.1 |
(1.1) |
N/A |
Utilities |
0.0 |
0.0 |
0.0 |
1.5 |
(1.5) |
N/A |
Consumer staples |
0.0 |
3.0 |
(3.0) |
8.4 |
(8.4) |
N/A |
100.0 |
100.0 |
100.0 |
Source: Atlantis Japan Growth Fund, Edison Investment Research, Bloomberg. Note: Rebased for gearing.
Setaishi highlights some of the positions in AJG’s portfolio as good examples of companies which meet the investment criteria: Funai Soken, Okada Aiyon and top 10 position Yamashin Filter. Funai Soken is a relatively new addition; it had been held in the past, but was sold when its valuation became stretched. It is a management consulting company providing services to c 5,000 small- and mid-sized companies across a range of sectors, including real estate and pharmacy chains. It has a high level of repeat business, with c 80% of customers renewing their contracts. The company has a team-based approach, which promotes low staff turnover and a high level of customer service. Funai Soken is able to supplement its organic growth with selected mergers and acquisitions, which is an increasing feature within the Japanese economy. The company has operating margins of c 25%, a return on equity of c 15% and earnings are growing at a double-digit annual rate.
Okada Aiyon manufactures equipment for the demolition of buildings, such as breakers, crushers, cutters and drills. It has a c 40% market share in Japan, which the company is aiming to grow to 50%. It has much lower presence in countries overseas, which offers the potential for growth. Demand is particularly strong for more environmentally friendly products, which are quieter and cleaner. There is potential for the company to expand its operating margins from the current level of c 10%, it has a return on equity of c 10% and accelerating double-digit annual earnings growth.
Yamashin Filter produces hydraulic filters, primarily for construction machines. The company has high market shares of more than 70% in Japan and c 50% worldwide. Yamashin Filter is expanding its product range to other sectors such as agriculture, food processing and industrial machines. About half of its business is replacement parts, which are higher-margin than filters for original equipment. The company has operating margins of c 10%, a return on equity of c 10% and annual earnings growth of more than 15%.
In recent months, new investments in the portfolio span a range of industries. These include systems integration specialist BayCurrent Consulting, which is a recovery situation. Following the company’s public offering in September 2016, it missed its earnings forecast, leading to a decline in its share price. The company now has a new management team and business is improving.
Performance: Strong record of outperformance
In H118 (ending 31 October 2017), AJG’s NAV and share price total returns of +27.8% and +24.2% respectively were meaningfully ahead of the benchmark’s +12.2% total return, in spite of the 3.5% dilution from the exercise of subscription shares at the beginning of October 2017. The strong performance was largely a result of the significant exposure to small- and mid-cap stocks, which outperformed large-cap stocks over the period, and also due to the portfolio’s bias towards growth rather than value stocks. On a stock-specific basis, major contributors to performance include: KH Neochem, a broad-based chemical company with operations in basic chemicals, performance materials and electronic materials; Nittoku Engineering, whose products include coil winding machines and peripheral systems; and removal company, Sakai Moving Service.
|
Exhibit 8: Investment trust performance to 31 January 2018 in sterling terms |
|
Price, NAV and benchmark total return performance, one-year rebased |
Price, NAV and benchmark total return performance (%) |
|
|
|
Source: Thomson Datastream, Edison Investment Research. Note: Three, five and 10-year performance figures annualised. |
|
As illustrated in Exhibit 8, over the last 12 months to end-January 2018, AJG’s NAV and share price total returns of +50.4% and +58.7% respectively, are considerably ahead of the benchmark’s 12.5% total return.
|
Exhibit 9: Share price and NAV total return performance, relative to indices (%) |
|||||||
|
One month |
Three months |
Six months |
One year |
Three years |
Five years |
10 years |
Price relative to TOPIX |
10.0 |
18.0 |
25.1 |
41.1 |
19.5 |
25.6 |
42.5 |
NAV relative to TOPIX |
8.8 |
13.1 |
20.8 |
33.7 |
15.9 |
25.7 |
37.2 |
Price relative to MSCI Japan Small Cap |
10.1 |
16.8 |
23.6 |
35.6 |
7.2 |
8.9 |
2.2 |
NAV relative to MSCI Japan Small Cap |
8.9 |
11.9 |
19.4 |
28.5 |
3.9 |
8.9 |
(1.6) |
Price relative to MSCI AC World |
8.6 |
16.9 |
26.7 |
40.0 |
24.8 |
31.1 |
21.7 |
NAV relative to MSCI AC World |
7.5 |
12.0 |
22.4 |
32.6 |
21.0 |
31.1 |
17.2 |
Price relative to FTSE All-Share |
11.3 |
18.3 |
29.4 |
42.6 |
47.3 |
68.4 |
64.4 |
NAV relative to FTSE All-Share |
10.1 |
13.3 |
25.0 |
35.1 |
42.8 |
68.5 |
58.3 |
|
Source: Thomson Datastream, Edison Investment Research. Note: Data to end-January 2018. Geometric calculation. All data in sterling. |
|||||||
Exhibit 9 shows AJG’s relative returns. The trust has outperformed the benchmark in both NAV and share price total return terms over all periods shown. We also compare its performance to the MSCI Japan Small Cap index; AJG has outperformed meaningfully over one year and also outperformed over three and five years, while lagging modestly over 10 years in NAV terms.
|
Exhibit 10: NAV total return performance relative to benchmark over three years |
|
|
Source: Thomson Datastream, Edison Investment Research |
As discussed in more detail in the shareholder activism section on page 5, since Setaishi was appointed as lead adviser in May 2016, there has been a meaningful improvement in investment performance. Despite an initial period of underperformance due to the strong relative performance of cyclical versus growth stocks, and the strength of fund flows into large-cap companies, between 1 May 2016 and 31 January 2018, AJG outperformed the benchmark by c 25pp, this is despite c 11.5% NAV dilution from the issuance of subscription rights.
Discount: Trades within a narrow range
AJG’s current 3.0% share price discount to NAV is at the low end of the last 12-month range of 3.0% to 13.0%. Over the last three years, the discount has generally stayed in a relatively narrow band. The current discount is narrower than the averages of the last one, three, five and 10 years of 8.9%, 8.9%, 8.4% and 9.9% respectively. Near term, there may be potential for the discount to narrow further, as there has been a stock overhang from a selling shareholder, although we note that the disposal is now complete. Longer-term drivers for a narrower discount include the simplified structure of the trust, a continuation of AJG’s positive investment performance, or increased investor demand for mid- and small-cap Japanese equities.
The trust adopted a hard discount control mechanism in 2013, whereby a continuation vote will be held if its shares have traded, on average, at a greater than 10% discount to NAV during any rolling 90-day period (in normal market conditions). If the vote is triggered, it will be held no later than the next practicable AGM. There is also a confirmed continuation vote at the October 2019 AGM. AJG has the authority, granted annually, to repurchase shares to help manage the discount. In FY17, 1.2m shares (2.7% of shares outstanding) were repurchased, at a weighted average discount of 10.2%.
|
Exhibit 11: Share price discount to NAV (including income) over three years (%) |
|
|
Source: Thomson Datastream, Edison Investment Research |
Capital structure and fees
AJG is a conventional investment trust with one class of share outstanding and there are currently 51.6m ordinary shares in issue. The trust has a ¥1.5bn (c £10m) credit facility with Royal Bank of Scotland International (RBSI). At end-FY17, ¥1.0bn (c £6.5m) was drawn down. The loan covenants state that the trust must hold at least 60 investments, of which at least 50 are quoted on the Tokyo Stock Exchange or any other equivalent exchange approved by RBSI. The amount of credit drawn down must not exceed 25% of AJG’s portfolio value and the trust’s NAV must not fall below $58m (c £40m). There are currently 70 stocks in the portfolio and the NAV is c $170m.
The investment manager is paid an annual management fee of 1% of NAV and is entitled to 1% of NAV of any redemption pool. No performance fee is payable. In FY17, ongoing charges were 1.52%, which was a meaningful decrease from 1.91% in FY16, which included one-off charges relating to the LIM shareholder proposal. The trust has also benefited from its bigger size, which spreads costs over a larger asset base.
AJG notionally allocates assets and liabilities into a redemption pool to facilitate investors wishing to sell part or all of their holdings, or it funds valid redemption requests from available cash. Ordinarily, shareholders have the opportunity to redeem their shares on a six-monthly basis (up to a maximum of 5% of AJG’s outstanding shares). This facility is at the discretion of the board, which aims to execute redemption requests in a timely manner, to minimise the impact on existing shareholders and the trust as a whole.
Starting in 2014, AJG operated a subscription share mechanism, aiming to increase net assets and market cap to widen the appeal to new investors. However, following two successful annual issues, which raised c £26m in aggregate (c £11m in FY16 and c £15m in FY17), the board viewed the process as a success, and believes that a simplified capital structure is more attractive to current and future shareholders. Following a resolution at the EGM on 23 November 2017, shareholders unanimously approved the cancellation of the subscription share programme.
Dividend policy and record
AJG has a focus on long-term capital growth rather than income. The last distribution was in 2012 and was immaterial. Since then there has been a change in adviser and company structure, however the dividend policy remains the same and the board does not intend to pay out a distribution. AJG’s portfolio currently yields 1.4%, which is modestly lower than the benchmark’s 1.5% yield.
Peer group comparison
There are four investment trusts in the AIC Japanese Smaller Companies sector, of which AJG is the smallest. Its NAV total return ranks first over one year, appreciably above average, while it is below average over three, five and 10 years. Despite a meaningful reduction versus the prior financial year, AJG’s ongoing charge remains the highest in the sector by a small margin. It has a below-average level of gearing, and similar to all its sector peers the trust has a zero dividend yield.
Exhibit 12: Japanese peer groups as at 6 February 2018*
% unless stated |
Market cap £m |
NAV TR |
NAV TR |
NAV TR |
NAV TR |
Discount (ex-par) |
Ongoing charge |
Perf. |
Net gearing |
Dividend yield (%) |
Atlantis Japan Growth |
115.6 |
47.8 |
83.7 |
150.7 |
200.6 |
(4.0) |
1.5 |
No |
104 |
0.0 |
Baillie Gifford Shin Nippon |
411.0 |
46.4 |
153.8 |
305.7 |
476.3 |
5.2 |
1.0 |
No |
112 |
0.0 |
Fidelity Japanese Values |
193.2 |
32.7 |
93.5 |
165.1 |
180.1 |
(10.3) |
1.5 |
No |
119 |
0.0 |
JPMorgan Japan Smaller Cos |
226.2 |
30.7 |
93.4 |
182.5 |
142.0 |
(10.2) |
1.3 |
No |
107 |
0.0 |
Average – Japanese Smaller Cos |
236.5 |
39.4 |
106.1 |
201.0 |
249.8 |
(4.9) |
1.3 |
111 |
0.0 |
|
Rank |
4 |
1 |
4 |
4 |
2 |
2 |
1 |
4 |
||
Aberdeen Japan |
91.8 |
17.7 |
51.7 |
89.1 |
191.5 |
(8.9) |
1.3 |
No |
109 |
1.0 |
Baillie Gifford Japan |
704.7 |
32.8 |
98.6 |
224.8 |
318.6 |
5.6 |
0.8 |
No |
115 |
0.0 |
CC Japan Income & Growth |
167.0 |
32.6 |
|
|
|
2.2 |
1.3 |
No |
114 |
2.3 |
JPMorgan Japanese |
693.4 |
23.2 |
75.8 |
153.5 |
158.9 |
(5.9) |
0.7 |
No |
117 |
1.2 |
Schroder Japan Growth |
267.5 |
13.3 |
62.0 |
127.9 |
153.5 |
(4.7) |
1.0 |
No |
112 |
1.6 |
Average – Japan |
384.9 |
23.9 |
72.0 |
148.8 |
205.6 |
(2.3) |
1.0 |
113 |
1.2 |
Source: Morningstar, Edison Investment Research. Note: *Performance as at 5 February 2018. TR=total return. Net gearing is total assets less cash and equivalents as a percentage of net assets.
To enable a broader performance comparison, in Exhibit 12 we also highlight the five peers in the AIC Japan sector. AJG’s NAV total returns are considerably higher than the sector average over one year, ahead over three and five years, while modestly trailing over 10 years.
The board
There are currently four directors on the board of AJG, all are non-executive and independent of the manager. All four directors hold shares in AJG, which helps to ensure an alignment with other shareholders. Chairman Noel Lamb was appointed to the board on 1 February 2011 and assumed his current role on 1 May 2014. He has a background in law and investment management, including Japanese equities, having worked at Lazard Japan Asset Management and Russell Investment Group, where he latterly served as chief investment officer. Philip Ehrmann was appointed to the board on 25 October 2013. He too has a background in investment management, having worked at Invesco Asset Management, Gartmore Investment Management and Jupiter Asset Management. He is currently a senior managing director at Manulife Asset Management overseeing global emerging markets equity portfolios. Richard Pavry was appointed to the board on 1 August 2016. He has a background in law and investment trusts and is currently head of investment trusts at Jupiter Asset Management. The newest member of the board is Michael Moule; he was appointed on 5 February 2018. He has a background in fund management and investment trusts, and is currently on the board of The European Investment Trust. In the last two years, there have been other significant changes in AJG’s board. Andrew Martin Smith retired as director and chairman of the audit committee effective from 31 July 2016, Eric Boyle retired with effect from 14 October 2016 and Takeshi Murakami with effect from 28 April 2017.
|
|
Future’s capital markets day (CMD) focused on its opportunity to grow brand reach globally, together with demonstrating the scalability of its platform to deliver that growth. There are particularly attractive prospects in the US market, where media revenue per online user is significantly less than it is in the UK. Our forecasts are unchanged at this point, but the emphasis on closing this revenue gap points to further strong growth potential. Management has an impressive M&A record, adding assets and driving returns on the brands. Progress has been reflected in the strong share price performance, but we still consider that the current rating does not fully reflect the opportunity.