Last close As at 05/08/2026
EUR21.35
▲ 0.05 (0.23%)
Market capitalisation
EUR376m
Research: Investment Companies
Deutsche Beteiligungs (DBAG) reported a 22.1% NAV return for the first nine months of FY17, and management guidance is for a further uplift in the final quarter, making it an exceptional year in terms of performance as well as portfolio activity. DBAG’s share price returns have significantly outperformed NAV returns over the last year, and the shares are currently trading at a substantial premium to NAV. In our view, this implies that the market is discounting strong future returns, arguably reflecting recent positive strategic developments that confirm DBAG’s ability to complete transactions successfully across a broader opportunity set.
Written by
Deutsche Beteiligungs |
FY17 confirmed as an exceptional year |
Investment companies |
19 October 2017 |
Share price/premium performance
Three-year performance vs index
Gearing
Analysts
|
||||||||||||||||||||||||||||||||||||||||||||||||||||||||||||||||||||||||||||||||||||
Deutsche Beteiligungs (DBAG) reported a 22.1% NAV return for the first nine months of FY17, and management guidance is for a further uplift in the final quarter, making it an exceptional year in terms of performance as well as portfolio activity. DBAG’s share price returns have significantly outperformed NAV returns over the last year, and the shares are currently trading at a substantial premium to NAV. In our view, this implies that the market is discounting strong future returns, arguably reflecting recent positive strategic developments that confirm DBAG’s ability to complete transactions successfully across a broader opportunity set.
12 months ending |
Share price |
NAV |
LPX Europe (%) |
LPX Europe NAV (%) |
SDAX (%) |
31/07/13 |
15.8 |
7.4 |
32.6 |
5.4 |
21.6 |
31/07/14 |
28.2 |
17.5 |
12.0 |
16.3 |
17.8 |
31/07/15 |
40.6 |
10.2 |
32.5 |
15.6 |
27.3 |
30/06/16* |
(6.5) |
8.5 |
(8.3) |
(1.8) |
(2.0) |
30/06/17 |
51.3 |
29.3 |
29.9 |
17.0 |
23.5 |
Source: Thomson Datastream. Note: *11-month period due to change in financial year end. Discrete total return performance in euros up to last reported NAV date.
Nine-month results confirm FY17 full-year prospects
Having completed seven divestments and six new investments in the financial year, making it a particularly active period in terms of deal activity, DBAG’s results for the first nine months of the year confirm FY17 as an exceptional year. DBAG’s NAV return for the nine months was 22.1% (after adjusting for the €1.20 FY16 dividend payment) and, if this is maintained or exceeded for the full year, FY17 will have recorded DBAG’s highest return since the global financial crisis. This performance compares with the 14.0% average NAV return over the previous five financial years. End-June 2017 financial resources of €41.7m were supplemented in July 2017 by the receipt of c €92m in disposal proceeds, giving DBAG a healthy funding position.
Outlook: Broadly unchanged full-year guidance
DBAG management has indicated that it expects FY17 net income to exceed the €78.6m reported for the first nine months of the financial year by up to 10%, which is consistent with previous guidance. No further disposals were announced prior to DBAG’s financial year end on 30 September 2017, and there were no major equity market moves that would have had a significant effect on the valuation multiples applied to portfolio companies, which suggests the outlook for FY17 is unlikely to have altered materially since the guidance was issued. The guidance translates into an expected year-end NAV per share between the current €28.54 and c €29.10.
Valuation: Ongoing strong growth being discounted
We see the value attributed by the market to DBAG’s fund services business as the main factor behind its shares trading at a premium to NAV. In our view, the current 59.1% premium to NAV implies that a premium is also being applied to the private equity investments business, arguably reflecting an expectation of robust growth continuing due to recent positive strategic developments.
Exhibit 1: Company at a glance
Investment objective and fund background |
Recent developments |
||||||
Deutsche Beteiligungs (DBAG) invests in mid-sized companies in Germany and neighbouring German-speaking countries via MBO transactions and growth capital financings. There is a focus on growth-driven profitable businesses valued at between €50m and €250m. DBAG’s core objective is to sustainably increase net asset value. |
■ 28 August 2017: Appointment of Dr Robert Schmidt strengthens DBAG investment team’s expertise in financial management and control. ■ 8 August 2017: Q317 results – NAV TR +8.7% vs LPX Europe NAV TR +3.3%. ■ 20 June 2017: MBO investment in duagon, a Switzerland-based provider of network components for data communication in railway vehicles. ■ 18 May 2017: Sale of ProXES Group to Capvis Equity Partners. ■ 16 May 2017: Sale of Schülerhilfe to Oakley Capital Private Equity. ■ 12 May 2017: Sale of Formel D to 3i. |
||||||
Forthcoming |
Capital structure |
Fund details |
|||||
AGM |
21 February 2018 |
FY16 net expense ratio* |
1.5% (2.9% unadjusted) |
Group |
Deutsche Beteiligungs |
||
Final results |
23 November 2017 |
Net cash |
9.0%** |
Manager |
Team managed |
||
Year end |
30 September |
Annual mgmt fee |
N/A (self-managed) |
Address |
Boersenstrasse 1 60313 Frankfurt am Main, Germany |
||
Dividend paid |
February 2018 |
Performance fee |
N/A (self-managed) |
||||
Launch date |
December 1985 |
Company life |
Unlimited |
Phone |
+49 69 95787-01 |
||
Continuation vote |
N/A |
Loan facilities |
€50m |
Website |
|||
Dividend policy and history (financial years) |
Share buyback policy and history (financial years) |
||||||
DBAG’s policy is to pay a stable or rising annual dividend. Prior to FY16, a base dividend was paid, supplemented by a surplus dividend based on realised gains. |
Share buybacks and capital increases are used to manage longer-term capital requirements. In FY16, a 10% increase in share capital raised €38.6m. |
||||||
|
|
||||||
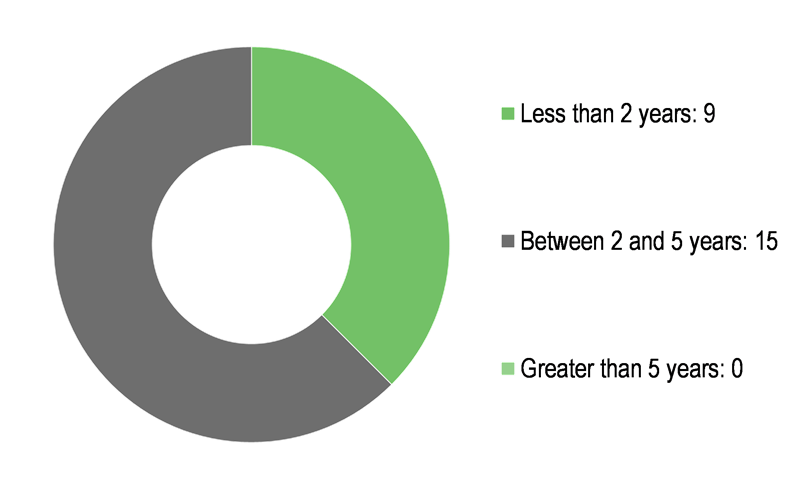
Number of portfolio companies by holding period (as at 30 June 2017)*** |
Portfolio exposure by sector (as at 30 June 2017)*** |
||||||
|
|
||||||
Shareholder base (as at 29 September 2017) |
Concentration of portfolio value by size (as at 30 June 2017)*** |
||||||
|
|
||||||
Source: DBAG, Edison Investment Research, Thomson Datastream. Note: *Based on expenses net of fee income; adjusted for non-recurring items. **Including €33.8m of securities classified as long-term assets. ***Does not include co-investment funds.
Realisations drive gains in first nine months of FY17
DBAG generated €34.5m net income in Q317, taking net income for the first nine months of FY17 to €78.6m. Both DBAG’s business lines made a positive contribution in the third quarter and over the nine months. The private equity investments segment generated €75.5m and the fund investment services segment contributed €3.1m to net income. NAV per share increased from €24.57 at end-September 2016 to €28.54 at end-June 2017, which translates into an NAV return for the nine months of 22.1%, after adjusting for FY16’s €1.20 per share dividend payment.
|
Exhibit 2: DBAG’s NAV per share progression during first nine months of FY17 |
|
|
Source: DBAG, Edison Investment Research |
The largest contribution to DBAG’s €93.9m gross valuation gains during the nine months came from the six divestments that were agreed in the period. Particularly strong contributions were made by the three sales announced in May 2017, Formel D, ProXES and Schülerhilfe, which achieved exit multiples ranging between 4.0x and 5.5x invested capital. While these three transactions were completed after the period end, the investments were valued at the sales transaction price at end-June 2017, thereby reflecting the total €60.1m gains on disposal as carried portfolio valuation gains in the period. Gross realised gains on the other three divestments in the period totalled €17.0m. Performance linked profit sharing on these gains in the form of carried interest entitlements amounted to €13.6m, with a further €1.6m of performance-related remuneration on the sale of Grohmann Engineering included in operating expenses. In addition to these strong gains on disposals, the majority of the companies in the carried portfolio saw valuation uplifts, largely driven by higher earnings forecasts, generating net unrealised gains of €16.9m.
In contrast to the corresponding prior year period, the fund investment services segment reported positive net income for the nine months, amounting to €3.1m, due to the significant additional fee income being received since the commencement of DBAG Fund VII’s planned four-year investment period at the start of 2017. Other income and expenses (as shown in Exhibit 2) largely comprised management fees relating to DBAG’s investments in DBAG Funds VI and VII, as well as DBAG Fund VII’s incorporation expenses, while other comprehensive income primarily related to the realisation of historical positive value movements on the sale of securities and negative valuation movements on long-term securities, reflecting recent rises in interest rates.
FY17 outlook broadly unchanged
As indicated in our August 2017 note, adjusting DBAG’s previous earnings guidance (issued with Q217 results) to include the c €27m net income contribution from the divestments of Formel D, Schülerhilfe and ProXES suggests that FY17 net income will reach c €83m, with NAV per share rising to c €28.90 at 30 September 2017. Alongside Q317 earnings, DBAG management has indicated that it expects FY17 net income to exceed the €78.6m reported for the first nine months by up to 10%, which is consistent with the previous guidance. No further disposals were announced prior to DBAG’s financial year end on 30 September 2017, and there were no major equity market moves prior to the year end that would have had a significant effect on the valuation multiples applied to portfolio companies, which suggests the outlook for FY17 is unlikely to have altered materially since the guidance was issued.
Commitments and financial resources
During the first nine months of FY17, DBAG’s financial resources declined from €72.6m to €41.7m, which comprised €7.9m in cash and €33.8m in high-grade German debt securities classified as long-term holdings. €74.6m of investment cash outflows were broadly matched by €68.2m of cash inflows, which largely consisted of proceeds from the disposals of Broetje-Automation, FDG and Grohmann Engineering, as well as the refinancing of the investment in Infiana. Outflows primarily related to new investments in Frimo, Braun, More than Meals, duagon and Vitronet Projekte, as well as a bridge loan for the investment in Rheinhold & Mahla. The other major cash outflow during the period was the €18.1m FY16 dividend payment. At end-June 2017, in addition to DBAG’s reported financial resources, €9.7m in cash and €5.3m in securities were held in unconsolidated investment vehicles, largely to fund c €20m of agreed investments in duagon and a group of radiology practices, which had not yet completed at the period end.
As at 30 June 2017, DBAG had made total capital commitments of €267m to the DBAG Fund VII and DBAG ECF funds, with an expected average investment rate of c €60m pa given the funds’ investment periods. Factoring in the prospect of an €18.1m dividend payment in early 2018 (if the FY17 is maintained at €1.20 per share), DBAG’s €41.7m financial resources at end-June 2017 could appear unlikely to cover the average expected level of capital calls over the next 12 months. However, c €92m net proceeds from the disposals of Romaco, Formel D and ProXES has been received since the period end, with a further c €25m due from the sale of Schülerhilfe, which completed in July 2017. Adding these proceeds increases DBAG’s financial resources to c €140m, presenting a much healthier funding position. In addition, DBAG’s €50m credit facility provides flexibility to manage short-term timing differences between cash inflows and outflows.
Valuation: Continuing strong growth being discounted
As illustrated in Exhibit 3, DBAG’s shares have traded at a premium to NAV for the majority of the period since end-October 2014, when it started reporting separately on its private equity investments and fund services businesses.
|
Exhibit 3: Share price premium/discount to NAV over three years (%) |
|
|
Source: Thomson Datastream, Edison Investment Research |
DBAG’s reported NAV does not reflect the market value of its fund services business, which has c €1.7bn of third-party assets under management, while DBAG’s share price reflects the value of both its private equity investments and fund services businesses. We see the value attributed by the market to the fund services business as the principal factor behind DBAG’s shares trading consistently at a premium to NAV over the last three years.
In our view, the anticipation of strong valuation gains from a series of successful realisation announcements led to the premium reaching 62.4% in May 2017 (an all-time high at that point), while the most likely explanation for the current c €250m or 59.1% market value premium to NAV is a market expectation of robust growth continuing, resulting in a premium being applied to the private equity investments business, in addition to the value attributed to the fund services business. This expectation is arguably driven by a number of positive strategic developments over the last year, including the launch of the €1bn DBAG Fund VII and its rapid pace of investment; the restructuring of DBAG ECF, followed by its first MBO investment; and the sale of Schülerhilfe, which demonstrated DBAG’s capability to transact successfully outside of its traditional core sectors.
Our previous analysis (see our August 2017 note) indicated that a valuation of up to c €160m was being attributed by the market to DBAG’s fund services business, giving a market-implied valuation multiple between 23x and 40x earnings. As the earnings outlook for the fund services business does not appear to have altered materially since the launch of DBAG Fund VII, we infer that the market is applying a c €90m premium to DBAG’s private equity investments business, which equates to a c 20% premium to NAV.
Peer group comparison
Exhibit 4 shows a comparison of DBAG with a selected peer group of Europe-focused listed private equity investment companies. DBAG is differentiated from peers, other than 3i, by its fund services business, as well as its focus on German mid-market companies. In sterling terms, DBAG’s NAV total return to 30 June 2017 is ahead of the peer group average over one, three, five and 10 years. Helped by a notably strong three-month period to end-June 2017, DBAG’s share price total return is significantly ahead of its NAV total returns over all periods shown, and has outperformed the peer group average over one, three, five and 10 years. Similar to 3i, which also incorporates a fund management business that is not restated at fair value in its accounts, DBAG’s shares are trading at a substantial premium to NAV, while the majority of peers are trading at a discount to NAV. DBAG’s 2.6% dividend yield is below the peer group average but at a broadly similar level to four of its eight peers.
Exhibit 4: Listed private equity investment companies peer group, as at 18 October 2017*
% unless stated |
Country |
Mkt cap £m |
NAV TR 1 year |
NAV TR 3 years |
NAV TR 5 years |
NAV TR 10 years |
Price TR 1 year |
Price TR 3 years |
Price TR 5 years |
Price TR 10 years |
Premium/ (discount) |
Dividend yield (%) |
Deutsche Beteiligungs |
Europe |
605.2 |
37.1 |
71.2 |
117.7 |
175.4 |
60.4 |
120.2 |
229.7 |
261.6 |
59.1 |
2.6 |
3i |
Global |
9,118.1 |
25.9 |
101.9 |
189.1 |
49.1 |
70.2 |
152.2 |
457.2 |
68.9 |
48.3 |
2.8 |
GIMV |
Global |
1,205.0 |
10.2 |
65.9 |
84.1 |
92.2 |
10.2 |
65.9 |
84.1 |
92.2 |
6.1 |
3.5 |
Electra Private Equity |
UK |
669.2 |
30.8 |
102.2 |
147.0 |
227.0 |
51.4 |
115.7 |
252.0 |
262.4 |
(13.0) |
8.8 |
HgCapital Trust |
UK |
636.4 |
18.2 |
61.0 |
80.0 |
170.7 |
45.7 |
87.8 |
120.2 |
170.3 |
(6.2) |
2.7 |
ICG Enterprise Trust |
UK |
575.2 |
20.0 |
33.9 |
64.0 |
104.8 |
37.6 |
36.7 |
118.4 |
101.8 |
(10.6) |
2.4 |
Oakley Capital Investments |
Europe |
335.9 |
9.7 |
23.5 |
35.5 |
|
40.7 |
10.5 |
55.5 |
|
(29.0) |
2.7 |
Princess Private Equity |
Global |
636.6 |
22.7 |
70.5 |
73.2 |
125.3 |
53.6 |
103.1 |
173.4 |
|
(4.0) |
5.3 |
Standard Life Private Equity |
Europe |
538.9 |
15.3 |
50.9 |
74.5 |
81.9 |
52.9 |
69.1 |
179.3 |
56.2 |
(9.7) |
3.4 |
Average |
1,591.2 |
21.1 |
64.6 |
96.1 |
128.3 |
47.0 |
84.6 |
185.5 |
144.8 |
4.6 |
3.8 |
|
Rank in peer group |
6 |
1 |
3 |
3 |
2 |
2 |
2 |
3 |
2 |
1 |
8 |
Source: Morningstar, Edison Investment Research. Note: *Performance data to end-June 2017. TR=total return. All returns expressed in sterling terms.
|
|
Research: Energy & Resources
SDX Energy has announced two successful well results in recent weeks, with additional oil discovered in Egypt and more net pay found in its first Moroccan gas well than expected. The next six months are busy ones for SDX, with eight more wells to be drilled in Morocco to supply a high value gas market. Two wells will be drilled in Egypt to delineate its existing South Disouq discovery and two exploration wells will target prospects that could materially increase the gas resources. In addition, programmes at NW Gemsa and Meseda should materially increase production. Our NAV increases from 64p to 65p/share (increases in absolute terms are partially offset by foreign exchange movements).