VinFast Auto — Focusing on top-line growth

VinFast Auto (NASDAQ: VFS)

Last close As at 20/03/2026

USD2.86

0.00 (0.00%)

Market capitalisation

USD6,692m

More on this equity

Research: Industrials

VinFast Auto — Focusing on top-line growth

VinFast Auto’s FY25 results highlight a year focused on scale, with electric vehicle (EV) deliveries rising 102% y-o-y to c 197k and e-scooter/e-bike deliveries increasing 473% to c 406k. Revenue rose 105.4% y-o-y to $3.6bn, while gross margin improved to -42.5% from -57.4%, indicating better fixed-cost absorption as volumes increased. The group remains loss-making, with net losses of c $3.9bn. However, FY25 showed progress in margin development, cost optimisation and utilisation, suggesting that early scale benefits are beginning to come through. As VinFast continues to increase its number of deliveries, the question is whether these gains can translate into stronger operating leverage, higher utilisation and a reduction in unit costs. We have updated our FY26 forecasts and introduce FY27 estimates.

Written by

Harry Kilby

Analyst

Industrials

FY25 results

23 March 2026

Price $2.81
Market cap $6,573m

Net cash/(debt) at 31 December 2025

$(6,874.0)m

Shares in issue

2,339.1m
Free float 2.1%
Code VFS
Primary exchange NASDAQ
Secondary exchange N/A
Price Performance
% 1m 3m 12m
Abs (9.8) (13.5) (10.9)
52-week high/low $3.8 $2.6

Business description

VinFast Auto is a Vietnamese pure-play electric vehicle manufacturer with a mission to accelerate global EV adoption through affordable technology-enabled vehicles. Incorporated in Singapore, listed on NASDAQ and headquartered in Hai Phong, Vietnam, VinFast is a subsidiary of Vingroup JSC, Vietnam's largest private conglomerate.

Next events

Q126 results

June 2026

Analysts

Harry Kilby
+44 (0)20 3077 5700
Finlay Mathers
+44 (0)20 3077 5700

VinFast Auto is a research client of Edison Investment Research Limited

Note: PBT and EPS are reported.

Year end Revenue ($m) EBITDA ($m) PBT ($m) EPS ($) EV/sales (x)
12/24 1,808.9 (1,870.7) (3,180.0) (1.36) 7.4
12/25 3,600.0 (2,393.0) (3,856.0) (1.65) 3.7
12/26e 6,537.0 (2,561.0) (3,770.0) (1.61) 2.1
12/27e 9,938.0 (710.0) (2,097.0) (0.90) 1.4

Portfolio restructure

VinFast announced a strategic restructure of its automotive portfolio into three distinct brand lines: VF for mass-market passenger EVs, Green for commercial mobility vehicles and Lac Hong for ultra-luxury models. The company also unveiled two new luxury vehicles under the Lac Hong range, the 800S and 900S, with commercial launch targeted for 2027. The restructure should provide greater portfolio clarity as VinFast continues to expand into international markets.

Further growth anticipated in 2026

Management has guided towards at least 300k EV deliveries and two-and-half times FY25 two-wheeler volumes (c 400k) in FY26. The majority of this top-line growth is anticipated to arise from within Vietnam (international deliveries in FY25 accounted for c 11% of total EV deliveries). The significant growth guided by management in e-scooter and e-bike deliveries (c one million in FY26e) is also primarily driven by growth across Vietnam, where VinFast will benefit from strong policy tailwinds (such as the ban in Hanoi on fossil-fuel motorbikes, which comes into effect on 1 July), as well as an increased focus on its international expansion into countries such as India, which had c 282m registered two-wheelers at end-2024 (c 1% electric).

Valuation: $7.7 per share represents c 170% upside

We value VinFast using a 10-year DCF valuation, cross-checked against EV/sales multiples for global and regional EV peers. This yields a valuation of $7.7/share, down from c $8.0/share previously, as we have deferred profitability break-even by one year on the FY25 results. Our assumptions continue to reflect a significant ramp-up in both EV and e-scooter deliveries, supported by elevated near-term capex as VinFast builds capacity for top-line growth, alongside improving gross margins as scale, utilisation and cost optimisation increase. We also assume continued, tapering, sponsor support for capex and working capital. For further background on VinFast, please see our initiation note.

FY25 results: Scale and top-line growth

VinFast’s FY25 results reflect a year of increased focus on accelerating top-line growth and improving operating efficiency gains over the near and medium term. The company is now operating at a materially greater scale, with some corresponding improvement in the cost base, but remains some way from profitability. Improvements in operating efficiencies are expected in the medium term as a result of the company benefiting from scale effects, as well as from its new platform 2.0 for its ‘next-gen’ EVs (which is expected to reduce costs by around 30%). However, VinFast’s direction, focusing on scale and growth in the near term, remains clear: deliveries and revenue more than doubled, margins improved materially and the international footprint broadened, although losses and funding requirements remained high.

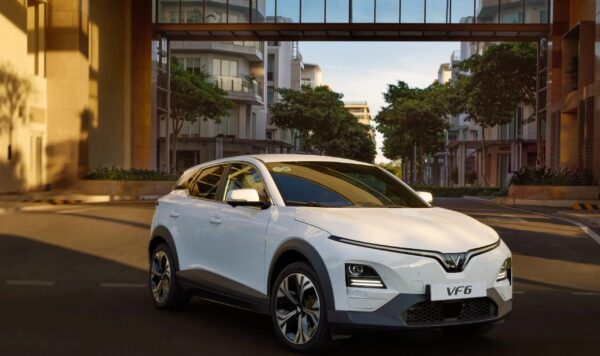
FY25 delivery growth was strong. VinFast delivered 196,919 EVs in FY25, up 102% y-o-y, exceeding management’s guidance to at least double FY24 deliveries and marking the company’s highest annual EV delivery rate since inception. E-scooter and e-bike deliveries rose 473% y-o-y to 406,498. Vehicle sales increased 111.3% to $3.38bn and total revenue rose 105.4% to $3.60bn, primarily driven by EV sales. Overseas markets accounted for around 11% of EV deliveries for the year, which remains modest in mix terms but marks a clear step forward in VinFast’s international expansion.

Operationally, FY25 also looked stronger than the group’s earlier-stage profile would suggest. VinFast ended 2025 with an estimated 36% share of Vietnam’s passenger vehicle market, up from c 22% in 2024, while management highlighted that the group finished the year ranked second in battery EVs in the Philippines, third in Indonesia and fourth in India. In our view, this matters because FY25 was not solely a domestic volume story; it was also the first year in which overseas positioning began to look more tangible, even if the absolute scale outside Vietnam remains relatively low at this stage.

At the profitability level, the group remains deeply loss-making, but FY25 showed some clearer evidence of scale benefits. Gross loss rose to $1.53bn from $1.01bn in FY24, adjusted EBITDA loss widened to $2.38bn from $1.80bn in FY24 and net loss increased 26% y-o-y to $3.87bn. However, gross margin improved to -42.5% from -57.4%, adjusted EBITDA margin improved to -66.0% from -102.5% and net loss margin improved to -107.5% from -175.7%. In our view, the improvements in margins are significant, as although the P&L is still heavily negative on any absolute measure, incremental scale is now moving the margin base in the right direction.

Below the gross profit line, cost performance was mixed. R&D spend was broadly flat year-on-year at $394m, but fell to 10.9% of revenue from 22.8% as sales scaled. SG&A increased to $848m from $672m, although on a relative basis it improved to 23.5% of revenue from 38.4%. Net other operating expense fell to $78m from $128m, mainly reflecting lower foreign exchange losses. Finance costs increased to $888m from $761m. Overall, the cost base remains heavy, but the revenue growth achieved in FY25 is starting to improve operating leverage.

FY25 was also a year of manufacturing build-out. VinFast inaugurated facilities in Ha Tinh in Vietnam, India and Indonesia during the year, taking its global manufacturing footprint to four facilities with combined maximum annual EV capacity of around 600,000 units. Hai Phong alone produced nearly 26,000 EVs in December and rolled out its 200,000th EV of the year on 31 December. The global showroom network reached 424 by year-end. In our view, this reinforces that FY25 was as much about building future volume capacity as it was about current year delivery.

Cash flow, balance sheet and funding

The funding picture remains central to VinFast’s equity story. VinFast ended FY25 with cash and cash equivalents of $293m, while total available liquidity was stated at up to $3.1bn, including undrawn support from Vingroup ($980m), remaining founder grants ($875m) and the YA standby equity facility ($968m). As at year-end, VinFast had drawn $413m under Vingroup’s support package and had received $1.1bn of the founder’s committed grant funding. In addition, the sale of spun-off R&D-related assets to Novatech generated around $1.6bn in cash, which had been paid in full by year-end. Still, VinFast’s expansion plan remains dependent on continued sponsor support.

In FY25, net cash outflow from operating activities was $1.77bn, capital expenditure was $922m and free cash outflow was $2.70bn on the company’s non-GAAP definition. A further point worth monitoring is demand mix. Approximately 27% of FY25 EV deliveries were to related parties, only one percentage point lower than in FY24. That does not detract from the very strong growth in reported deliveries, but it does mean investors are likely to continue watching the split between third-party retail demand and affiliated fleet demand as VinFast expands further across Asia.


Outlook for FY26

Looking ahead, management is targeting at least 300,000 EV deliveries in 2026 and 2.5x FY25 two-wheeler volumes (c 400,000). VinFast’s 2026 priorities include expanding capacity in Vietnam, resuming construction of the North Carolina (US) facility in 2026 with start of production targeted for 2028, commercialising next-generation VF 6 and VF 7 models, and continuing to deepen the dealer network across core Asian markets (double dealer footprint in India and work with larger more mature dealerships in Indonesia and the Philippines) and expand its two-wheeler business to five Asian countries, including Thailand and Malaysia. Overall, FY25 strengthened the argument that VinFast can scale volumes quickly. The harder next step is converting that scale into sustainably better margins and lower dependence on sponsor funding.

R&D, AI and technology platform

VinFast’s FY25 R&D effort remained broad based, with investment directed not only towards new models, but also towards the underlying vehicle architecture, software stack and manufacturing platform. R&D expense was $394m in FY25, broadly flat year-on-year, while falling to 10.9% of revenue from 22.8% in FY24, as the business scaled. The focus remained on next-generation vehicle platforms, ADAS L2+ development, the E/E 2.0 architecture and model refresh programmes. In our view, this is an important point in the context of FY25: margin improvement was achieved alongside continued engineering investment, rather than through a pull-back in development spend.

The strategic logic increasingly looks centred on deeper control of the technology stack. VinFast is developing a software-defined vehicle architecture built around distributed electronic control units (ECUs), domain and zonal systems, and OTA update capability, alongside a broader software layer covering remote control, vehicle management, advanced driver assistance systems (ADAS), battery care, navigation, smartphone integration and AI voice assistance in local languages. This should help simplify system design and reduce component complexity over time, while also giving the company greater control over the in-car user experience and vehicle functionality.

This technology effort is also being tied more directly to manufacturing economics. VinFast is integrating AI and automation into its smart-manufacturing model through VinRobotics, with applications including industrial humanoids for material handling and internal logistics, robot-arm visual AI for defect detection and process monitoring, adaptive automation and IoT-enabled predictive maintenance. The relevance for investors is straightforward: this is not purely a product-differentiation story. Management is clearly trying to use automation, AI and software integration to improve productivity, lift quality control and reduce downtime, with the ultimate aim of improving plant utilisation and lowering unit costs.

VinFast’s wider R&D engine also provides a competitive advantage. VinFast benefits from the broader Vingroup ecosystem spanning software engineering, ADAS and battery research, cybersecurity, charging infrastructure, fleet deployment and robotics. This provides the company with access to capabilities that many early-stage OEMs would need to outsource or build more slowly, particularly in charging, vehicle software, industrial automation and real-world fleet data. The benefit is potentially faster development and tighter integration across the product and operating platform, although it also places a premium on execution across a relatively complex ecosystem.

There is now a clearer product read-across from its R&D investment. The next-generation VF 6 and VF 7 are expected to start production in H226 and sit alongside Limo Green and VF MPV 7 as the next key launches. Importantly, these vehicles are intended to deliver structurally lower materials costs through reduced component count and simplified system design, enabled by the new platform and next-generation electrical architecture.

VinFast is also building optionality in autonomy and AI-enabled mobility. The group continues to develop its ADAS stack from L2+ towards L4 through a combination of in-house capability and selected external partnerships (Autobrains and Tensor). It is pursuing robocar development on what it describes as a capital-efficient basis, supported by its internal ADAS research capability and partnerships such as Tensor, where VinFast is acting as manufacturing and industrialisation partner for a pre-production robocar programme. The company also plans to expand robocar trials in major cities and selected international markets. While this remains longer dated than the core manufacturing and cost agenda, it does strengthen the broader technology narrative and suggests VinFast is trying to position itself as more than a conventional EV assembler.

Overall, FY25 suggests VinFast’s R&D strategy is becoming more coherent. The company is investing across vehicle software, electrical architecture, AI, automation and autonomy, but the more immediate relevance is practical rather than aspirational. The key question is whether that broader technology platform can support lower-cost next-generation vehicles, better factory efficiency and a more credible path towards margin improvement over the medium term.

Forecasts

We have marginally reduced our FY26 revenue forecast to $6.5bn from $6.6bn, reflecting a slightly more cautious stance on EV volumes following management’s guidance for at least 300,000 deliveries in FY26. We now forecast c 315,000 EV deliveries, down from 330,000 previously, which we view as achievable given current installed EV manufacturing capacity of c 600,000 units. This is partly offset by a material increase in our e-scooter and e-bike forecast to c one million units from c 400,000 previously, following management guidance for FY26 two-wheeler deliveries of at least 2.5x FY25 levels.

The more immediate constraint is two-wheeler capacity rather than demand. VinFast’s current e-scooter and e-bike manufacturing capacity stands at c 500,000 units, implying a meaningful capacity expansion will be required in H126 to support the guided delivery target. We do not see this as problematic in the context of the group’s current investment phase. VinFast invested c $922m in capex in FY25, up from c $686m in FY24, and management has indicated that capex will increase again in FY26 as it prioritises top-line growth. We therefore forecast FY26 and FY27 capex of c $1.2bn and $1.0bn respectively, with the principal use being the expansion of domestic and international e-scooter and e-bike manufacturing capacity. Beyond this build-out phase, we would expect capex intensity to begin to normalise from 2028.

Previously we forecast VinFast to generate a gross profit in 2026; however, in FY25 the company’s gross loss widened, despite the improvement in margin. Therefore, we have pushed out our expectations of break-even by a year, to FY27, now forecasting a gross loss of c $1.3bn in FY26 and a gross profit of c $0.8bn in FY27. We see a further improvement in gross margin in FY26. We now expect VinFast to become EBITDA and free cash flow positive in FY28, when we anticipate the company to have a significantly better utilisation and cost optimisation rate.

Overall, cash flow is expected to remain depressed for a few years, driven by operating losses and ongoing capex spend on product, plants and distribution. We assume that this gap is covered by a combination of third-party bank debt and sizeable sponsor support in the form of both new shareholder loans and non-repayable grants. On this basis, and including related-party borrowings in the definition, VinFast is projected to remain in a material net debt position over the forecast horizon, at around $8–10bn on our numbers, although this is contingent on continuing sponsor injections as well as access to external funding.

In our long-run assumptions we anticipate that EV sales will contribute between 84% and 90% of revenue, while e-scooters will contribute between 8% and 10% of revenue (with the 10% being in the back end of our model). The increase in contribution from e-scooters is partially due to structural tailwinds (as discussed above) in Vietnam (Hanoi initially). The Asian market has also historically been dominated by the two-wheeler segment, hence we expect continued strong growth in two-wheeler sales alongside a significant increase in car volumes across these markets.

Valuation: $7.7/share, c 170% upside

We value VinFast using a 10-year discounted cash flow (DCF). On our revised base case estimates this indicates an equity value for VinFast of c $18.0bn (down from $18.6bn previously, see our initiation note), which is equivalent to $7.7/share (c $8.0/share previously), approximately 170% higher than the current share price. The reduction in our valuation versus our previous estimate is driven primarily by weaker-than-expected FY25 profitability. Gross loss widened to c $1.5bn from c $1.0bn in FY24, rather than narrowing as we had previously anticipated, despite the improvement in margin, leading us to shift our break-even expectations for gross profit to 2027e from 2026e and our EBITDA inflection point assumption to 2028e from 2027e. However, this revision was partly offset by a more constructive long-term view on VinFast’s e-scooter and e-bike business following the sharp increase in deliveries during FY25. With management guiding FY26 e-scooter deliveries to be c 2.5x FY25 levels, or around one million units, we expect this segment to become a more meaningful contributor to group profit as scale improves.

Our DCF is based on volume and margin forecasts, with free cash flow remaining negative throughout FY27 (previously FY26), turning positive in FY28 (previously 2027) as utilisation improves and costs fall as a result of scale effects and new production platforms ramping up. We expect capex to normalise from FY28 following a period of increased spending (FY25: $0.9bn, FY26e: $1.2bn) as VinFast’s looks to rapidly scale its manufacturing capacity capturing top-line growth.

Our key DCF assumptions include a weighted average cost of capital (WACC) of 11.0–12.0%, based on a risk-free rate of 3.9%, a beta of 1.3 and an equity risk premium of 8.2%, with after-tax cost of debt of c 12–13%. We assume a terminal growth rate of 3.0% in nominal US dollars and a terminal EBIT margin of c 13–14%, with maintenance capex broadly in line with depreciation. All related-party borrowings from Vingroup and the founder are treated as debt, while grants and equity-like injections are treated as permanent capital.

As a cross-check, the DCF-derived enterprise value of $24.9bn equates to EV/sales multiples of c 3.8x FY26e and c 2.5x FY27e on our forecasts. We regard these levels as a reasonable balance between VinFast’s rapid top-line growth prospects and the execution and funding risks embedded in the investment case.

General disclaimer and copyright

This report has been commissioned by VinFast Auto and prepared and issued by Edison, in consideration of a fee payable by VinFast Auto. Edison Investment Research standard fees are £60,000 pa for the production and broad dissemination of a detailed note (Outlook) following by regular (typically quarterly) update notes. Fees are paid upfront in cash without recourse. Edison may seek additional fees for the provision of roadshows and related IR services for the client but does not get remunerated for any investment banking services. We never take payment in stock, options or warrants for any of our services.

Accuracy of content: All information used in the publication of this report has been compiled from publicly available sources that are believed to be reliable, however we do not guarantee the accuracy or completeness of this report and have not sought for this information to be independently verified. Opinions contained in this report represent those of the research department of Edison at the time of publication. Forward-looking information or statements in this report contain information that is based on assumptions, forecasts of future results, estimates of amounts not yet determinable, and therefore involve known and unknown risks, uncertainties and other factors which may cause the actual results, performance or achievements of their subject matter to be materially different from current expectations.

Exclusion of Liability: To the fullest extent allowed by law, Edison shall not be liable for any direct, indirect or consequential losses, loss of profits, damages, costs or expenses incurred or suffered by you arising out or in connection with the access to, use of or reliance on any information contained on this note.

No personalised advice: The information that we provide should not be construed in any manner whatsoever as, personalised advice. Also, the information provided by us should not be construed by any subscriber or prospective subscriber as Edison’s solicitation to effect, or attempt to effect, any transaction in a security. The securities described in the report may not be eligible for sale in all jurisdictions or to certain categories of investors.

Investment in securities mentioned: Edison has a restrictive policy relating to personal dealing and conflicts of interest. Edison Group does not conduct any investment business and, accordingly, does not itself hold any positions in the securities mentioned in this report. However, the respective directors, officers, employees and contractors of Edison may have a position in any or related securities mentioned in this report, subject to Edison's policies on personal dealing and conflicts of interest.

Copyright 2026 Edison Investment Research Limited (Edison).

Australia

Edison Investment Research Pty Ltd (Edison AU) is the Australian subsidiary of Edison. Edison AU is a Corporate Authorised Representative (1252501) of Crown Wealth Group Pty Ltd who holds an Australian Financial Services Licence (Number: 494274). This research is issued in Australia by Edison AU and any access to it, is intended only for "wholesale clients" within the meaning of the Corporations Act 2001 of Australia. Any advice given by Edison AU is general advice only and does not take into account your personal circumstances, needs or objectives. You should, before acting on this advice, consider the appropriateness of the advice, having regard to your objectives, financial situation and needs. If our advice relates to the acquisition, or possible acquisition, of a particular financial product you should read any relevant Product Disclosure Statement or like instrument.

New Zealand

The research in this document is intended for New Zealand resident professional financial advisers or brokers (for use in their roles as financial advisers or brokers) and habitual investors who are “wholesale clients” for the purpose of the Financial Advisers Act 2008 (FAA) (as described in sections 5(c) (1)(a), (b) and (c) of the FAA). This is not a solicitation or inducement to buy, sell, subscribe, or underwrite any securities mentioned or in the topic of this document. For the purpose of the FAA, the content of this report is of a general nature, is intended as a source of general information only and is not intended to constitute a recommendation or opinion in relation to acquiring or disposing (including refraining from acquiring or disposing) of securities. The distribution of this document is not a “personalised service” and, to the extent that it contains any financial advice, is intended only as a “class service” provided by Edison within the meaning of the FAA (i.e. without taking into account the particular financial situation or goals of any person). As such, it should not be relied upon in making an investment decision.

United Kingdom

This document is prepared and provided by Edison for information purposes only and should not be construed as an offer or sol icitation for investment in any securities mentioned or in the topic of this document. A marketing communication under FCA Rules, this document has not been prepared in accordance with the legal requirements designed to promote the independence of investment research and is not subject to any prohibition on dealing ahead of the dissemination of investment research.

This Communication is being distributed in the United Kingdom and is directed only at (i) persons having professional experience in matters relating to investments, i.e. investment professionals within the meaning of Article 19(5) of the Financial Services and Markets Act 2000 (Financial Promotion) Order 2005, as amended (the "FPO") (ii) high net-worth companies, unincorporated associations or other bodies within the meaning of Article 49 of the FPO and (iii) persons to whom it is otherwise lawful to distribute it. The investment or investment activity to which this document relates is available only to such persons. It is not intended that this document be distributed or passed on, directly or indirectly, to any other class of persons and in any event and under no circumstances should persons of any other description rely on or act upon the contents of this document.

This Communication is being supplied to you solely for your information and may not be reproduced by, further distributed to or published in whole or in part by, any other person.

United States

Edison relies upon the "publishers' exclusion" from the definition of investment adviser under Section 202(a)(11) of the Investment Advisers Act of 1940 and corresponding state securities laws. This report is a bona fide publication of general and regular circulation offering impersonal investment-related advice, not tailored to a specific investment portfolio or the needs of current and/or prospective subscribers. As such, Edison does not offer or provide personal advice and the research provided is for informational purposes only. No mention of a particular security in this report constitutes a recommendation to buy, sell or hold that or any security, or that any particular security, portfolio of securities, transaction or investment strategy is suitable for any specific person.

London │ New York │ Frankfurt

20 Red Lion Street

London, WC1R 4PS

United Kingdom

More on VinFast Auto

View All

Latest from the Industrials sector

View All Industrials content

Research: Healthcare

Mendus — Agreement to advance AML programme

Mendus has announced a new clinical collaboration with the Olivia Newton-John Cancer Research Institute (ONJCRI) to support the Phase Ib DIVA trial, evaluating lead cancer vaccine vididencel in chemo-unfit acute myeloid leukaemia (AML) patients. The agreement formalises the start of trial preparations and represents a key step in executing the company’s updated clinical strategy to broaden the positioning of vididencel into the growing first-line AML setting, particularly among patients treated with venetoclax and azacitidine (Ven-Aza). We view this as an important operational milestone that advances Mendus’s plans to expand the addressable patient population, while generating clinical data to guide a future pivotal programme. The DIVA study is on track to commence from mid-2026, consistent with prior guided timelines.

Continue Reading