Last close As at 06/08/2026
GBP3.78
▲ 4.00 (1.07%)
Market capitalisation
GBP1,342m
Research: Investment Companies
Worldwide Healthcare Trust (WWH) is managed by Sven Borho and Trevor Polischuk of specialist healthcare investor OrbiMed. The managers are positive on the outlook for healthcare stocks in 2019, following a volatile period for global equities so far in 2018. They see reduced political pressure on the sector following the US mid-term elections and believe there will be more of a focus on company fundamentals. The managers cite a series of novel therapeutic products under development, which could meaningfully bolster the revenues and earnings of companies that can successfully bring these drugs to market. In addition, they suggest that an increase in mergers and acquisitions could also focus investor attention on the healthcare sector’s potential.
Worldwide Healthcare Trust |
Expecting a less turbulent industry environment |
Investment trusts |
22 November 2018 |
Share price/discount performance
Three-year performance vs index
Gearing
Analysts
|
|||||||||||||||||||||||||||||||||||||||||||||||||||||||||||||||||||||||||||||||||||||||||||||
Worldwide Healthcare Trust (WWH) is managed by Sven Borho and Trevor Polischuk of specialist healthcare investor OrbiMed. The managers are positive on the outlook for healthcare stocks in 2019, following a volatile period for global equities so far in 2018. They see reduced political pressure on the sector following the US mid-term elections and believe there will be more of a focus on company fundamentals. The managers cite a series of novel therapeutic products under development, which could meaningfully bolster the revenues and earnings of companies that can successfully bring these drugs to market. In addition, they suggest that an increase in mergers and acquisitions could also focus investor attention on the healthcare sector’s potential.
12 months ending |
Share price |
NAV |
MSCI World |
DS World Pharm and Biotech (%) |
FTSE All-Share |
31/10/14 |
40.3 |
38.6 |
24.3 |
24.5 |
1.0 |
31/10/15 |
11.0 |
13.1 |
10.6 |
9.3 |
3.0 |
31/10/16 |
12.6 |
15.4 |
17.6 |
13.2 |
12.2 |
31/10/17 |
26.7 |
17.1 |
10.1 |
7.7 |
13.4 |
31/10/18 |
1.7 |
2.3 |
12.9 |
9.7 |
(1.5) |
Source: Thomson Datastream. Note: All % on a total return basis in pounds sterling.
Investment strategy: Diligent, bottom-up research
The managers and the team at OrbiMed undertake diligent fundamental research, with inputs including analysis of clinical events, regulatory developments and new drug launches, along with meeting company managements. The resulting portfolio of c 80 holdings is selected from a universe of c 1,000 stocks and is diversified by geography, industry subsector and market capitalisation. The US dominates the global healthcare industry and represents c 75% of WWH’s portfolio. Gearing is regularly employed in the trust (up to 20% of NAV is permitted); at end-October 2018, net gearing was 10.5%.
Market outlook: Healthcare sector looks interesting
Fundamentals within the global healthcare sector are favourable, supported by a series of novel therapies under development, a benign regulatory environment and less political discussion surrounding US drug pricing. These attributes are in addition to long-term demand for healthcare products and services due to ageing demographic profiles, particularly in developed markets. If the sector continues to generate robust earnings growth, it could build on its record of outperformance compared with the wider equity market.
Valuation: Trading close to NAV
WWH’s share price is trading at a 1.9% premium to its cum-income NAV. This compares with an average 0.5% premium over the last 12 months and an average 2.9% discount over the last five years. The board targets a maximum discount of 6%, but has not repurchased any shares since FY17, although share issuance has been high (Exhibit 1). While WWH aims to generate long-term capital growth, it also offers a 0.7% dividend yield.
Exhibit 1: Trust at a glance
Investment objective and fund background |
Recent developments |
||||||||||||||||||||||||||||||||||||||||||||||||||||||||||||||||||||||
Worldwide Healthcare Trust’s investment objective is to invest worldwide in pharmaceutical, biotechnology and related securities in the healthcare sector to achieve a high level of capital growth. Gearing and derivative transactions are used to mitigate risk and enhance capital returns. In 2010, the mandate was broadened to include healthcare equipment and services and healthcare technology. |
■ 22 November 2018: Six-month results to 30 September 2018. NAV TR +20.0% versus benchmark TR +23.3%, share price TR +21.1%. ■ 14 November 2018: announcement of first interim dividend of 6.5p per share (unchanged year-on-year). ■ 15 June 2018: 12-month results to 31 March 2018. NAV TR +2.8% versus benchmark TR -2.5%, share price TR +5.3%. ■ 8 June 2018: announcement of second interim dividend of 11.0p per share |
||||||||||||||||||||||||||||||||||||||||||||||||||||||||||||||||||||||
Forthcoming |
Capital structure |
Fund details |
|||||||||||||||||||||||||||||||||||||||||||||||||||||||||||||||||||||
AGM |
September 2019 |
Ongoing charges |
0.9% |
Group |
Frostrow Capital LLP (AIFM) |
||||||||||||||||||||||||||||||||||||||||||||||||||||||||||||||||||
Interim results |
November 2018 |
Net gearing |
10.5% |
Manager |
OrbiMed Advisors LLC |
||||||||||||||||||||||||||||||||||||||||||||||||||||||||||||||||||
Year end |
31 March |
Annual mgmt fee |
See page 7 |
Address |
25 Southampton Buildings, London, WC2A 1AL, UK |
||||||||||||||||||||||||||||||||||||||||||||||||||||||||||||||||||
Dividend paid |
January, July |
Performance fee |
See page 7 |
||||||||||||||||||||||||||||||||||||||||||||||||||||||||||||||||||||
Launch date |
April 1995 |
Trust life |
Indefinite |
Phone |
+44 (0)20 3008 4910 |
||||||||||||||||||||||||||||||||||||||||||||||||||||||||||||||||||
Continuation vote |
Five-yearly, next in 2019 |
Loan facilities |
Up to 20% of net assets |
Website |
|||||||||||||||||||||||||||||||||||||||||||||||||||||||||||||||||||
Dividend policy and history (financial years) |
Share buyback policy and history (financial years) |
||||||||||||||||||||||||||||||||||||||||||||||||||||||||||||||||||||||
In line with the requirement for investment trusts to pay out 85% of their income net of expenses, two interim dividends a year are paid in January and July. |
The trust has authority to purchase up to 14.99% and allot up to 10% of issued share capital. Allotments in the chart include exercise of subscription shares. |
||||||||||||||||||||||||||||||||||||||||||||||||||||||||||||||||||||||
|
|
||||||||||||||||||||||||||||||||||||||||||||||||||||||||||||||||||||||
Shareholder base (as at 31 October 2018) |
Portfolio exposure by geography (as at 31 October 2018) |
||||||||||||||||||||||||||||||||||||||||||||||||||||||||||||||||||||||
|
|
||||||||||||||||||||||||||||||||||||||||||||||||||||||||||||||||||||||
Top 10 holdings (as at 31 October 2018) |
|||||||||||||||||||||||||||||||||||||||||||||||||||||||||||||||||||||||
|
|||||||||||||||||||||||||||||||||||||||||||||||||||||||||||||||||||||||
Source: Worldwide Healthcare Trust, Edison Investment Research, Bloomberg, Morningstar. Note: *N/A where not in end-October 2017 top 10.
Market outlook: Positive for the healthcare sector
Exhibit 2 (LHS) shows that healthcare and biotechnology investors have enjoyed significant share price gains in the last five years, albeit with higher volatility of returns from biotech stocks compared with the wider sector. Pharma stocks make up the majority of the global healthcare sector and are trading on a forward P/E multiple of 15.7x, which is a modest discount to the 16.4x average of the last five years. In relative terms, pharma stocks are trading at a 4.2pp higher premium to global equities versus the 11.0% five-year average. However, there are reasons to suggest that healthcare investors may continue to enjoy above-average total returns. On a long-term view, ageing populations in developed markets will continue to provide robust demand for both healthcare products and services. In the near term, there is potential for increased demand for healthcare stocks from generalist investors due to a high level of industry innovation, a benign regulatory environment and a reduced focus on US drug prices following the American mid-term elections. In addition, an increase in merger and acquisition (M&A) activity within the healthcare industry could lead to further share price appreciation.
|
Exhibit 2: Market performance and valuation |
|
MSCI World Health Care and NASDAQ Biotech indices total returns (£) |
Absolute and relative forward P/E multiple for DS World Pharma index |
|
|
|
Source: Thomson Datastream, Edison Investment Research. Note: Valuation data as at 21 November 2018. |
|
Fund profile: Global healthcare equity exposure
WWH was launched in 1995 and is managed by OrbiMed, one of the largest specialist healthcare investment managers in the world with c $14bn of assets under management. OrbiMed employs 82 investment professionals, 15 of whom are former healthcare company founders or CEOs. There is a team of 25 people focusing on public equities. WWH is managed by Sven Borho, one of OrbiMed’s founders and partners, assisted by Trevor Polischuk, also a partner at OrbiMed. They aim to generate long-term capital growth from a diversified portfolio of equities across the market-cap spectrum and range of healthcare industry subsectors.
The trust is benchmarked against the MSCI World Health Care index (sterling adjusted) and has a series of investment guidelines. At the time of investment, a maximum 15% of the portfolio is permitted in a single holding; normally, at least 60% will be invested in larger companies (market cap above $5bn); at least 20% will be in smaller companies (market cap below $5bn); up to 10% is permitted in unquoted securities; and a maximum 5% is permitted in debt instruments, convertibles and royalty bonds issued by pharmaceutical and biotechnology companies. Sector limits allow up to 20% of the portfolio to be invested in each of the healthcare equipment and supplies, healthcare technology, or healthcare providers and services sectors. Gearing of up to 20% of net assets is permitted; at end-October 2018, net gearing was 10.5%.
The fund managers: Sven Borho and Trevor Polischuk
The manager’s view: Reasons to remain optimistic
Manager Polischuk says that while politics often dominates the healthcare industry headlines, so far the current Trump administration has been a net positive. Although discussions about drug pricing continue, he believes tax reform is an underappreciated tailwind for US corporations. The manager notes that for the large-cap healthcare companies, lower tax payments have boosted earnings by up to a low-teens percentage, which has freed up cash for servicing debt, higher dividends, share repurchases and increased levels of M&A.
Within the US, the country that dominates the global healthcare industry, the manager highlights the favourable regulatory environment. To reduce drug prices by promoting increased competition, the Food and Drug Administration is accelerating drug approvals. This year is on course to be another record for approvals for the use of new molecular entities and new generic drugs.
The manager explains that, so far, President Trump’s policy statements have been benign for the US healthcare industry. In October 2018, Trump talked about an international pricing index (IPI), which would target Medicare Part B drugs, pegging their prices to the average of a basket of 16 other countries, where prices are considerably lower. However, IPI is lacking in detail and, if implemented, would not take effect until 2020 at the earliest. Most importantly, the proposal showed that direct government negotiation of drug prices is not under consideration. Polischuk says the outcome of the US mid-term elections, where the Republicans maintained a majority in the Senate but lost control of the House of Representatives, minimises the risk of punitive legislation affecting the healthcare industry.
Polischuk is excited about the prospects for the healthcare sector, citing a ‘golden era of innovation’. He highlights a series of novel technologies that are coming to market: protein correctors; CAR-T cell therapy; gene therapy; gene silencing; and bispecific antibodies. The manager believes there are multi-billion dollar revenue opportunities for companies able to bring these novel products to market, to treat a range of conditions including cystic fibrosis and cancer. Polischuk highlights Alzheimer’s disease, suggesting a drug that could halt its progression has the potential to be the largest-selling pharmaceutical ever. He says there are 5.7 million people in the US suffering from Alzheimer’s, which exceeds the current 5.1 million US cancer patients. So far, all late-stage trials for Alzheimer’s drugs have failed; however, the manager is optimistic about future developments on the basis that every ‘failed’ trial has shown some degree of efficacy (cognitive benefit). He believes it is only a matter of time before there is a drug approved for the treatment of Alzheimer’s, where the companies with the most advanced programmes in the category are the partnership between Biogen (based in the US) and Eisai (Japan), and Roche Holding (Switzerland).
In terms of M&A, Polischuk says that within large-cap healthcare companies, the appetite for deals is very strong. The pace of M&A was subdued in 2017, ahead of the introduction of US tax reforms, followed by a flurry of activity early in 2018, including Takeda Pharmaceutical’s bid for Shire, Celgene’s for Juno Therapeutics and the Novartis bid for AveXis. However, the manager explains that the level of healthcare industry M&A activity has slackened in recent months. He suggests there has been a ‘wait and see’ attitude because of continued discussion about US drug prices, and that companies looking to make acquisitions believe the price of target firms is too high, while smaller companies are not under pressure to sell as they continue to have easy access to capital. Polischuk believes that once the backdrop changes, perhaps in response to more choppy stock markets as witnessed in October 2018, there is the possibility of an uptick in M&A, which could be an important driver for the sector.
Asset allocation
Investment process: In-depth fundamental research
Borho and Polischuk are able to draw on the broad resources of OrbiMed’s investment team to construct a diversified portfolio of global healthcare stocks, across the market cap spectrum, aiming to generate long-term capital growth. Inputs into the in-depth research process include: clinical events; medical meetings; regulatory events; new drug launches; doctor surveys; and field research. Meeting company management is a key element of the investment process. WWH’s portfolio typically has around 80 positions selected from an investment universe of c 1,000 stocks. It is regularly monitored as a function of OrbiMed’s Public Equity Portfolio Review, where the whole public equities team meets five times a week to discuss all of WWH’s holdings.
Current portfolio positioning
At end-October 2018, the trust’s top 10 positions made up 37.6% of the portfolio, which was a higher concentration than 31.8% a year earlier; seven positions were common to both periods. In terms of changes in sector exposure (Exhibit 3, LHS); over the six months to the end of October, WWH has increased exposure to healthcare providers/services (+8.4pp) and has less biotech exposure (-6.0pp). On a regional basis, WWH has higher exposure to the key North American market (+11.9pp), with reductions in the other three much smaller regions. Compared with the benchmark, the trust has an overall underweight position in pharma (underweight large-cap pharma and overweight speciality pharma/generics), and an overweight position in biotech (more so in emerging, rather than large-cap biotech). WWH’s c 9.5% emerging market exposure compares with a zero weighting in the benchmark.
Exhibit 3: Portfolio sector and geographic exposure (%)
Sector |
End-Oct 2018 |
End-Apr 2018 |
Diff. (pp) |
Region |
End-Oct 2018 |
End-Apr 2018 |
Diff. (pp) |
|
Pharmaceutical |
31.8 |
30.1 |
1.7 |
North America |
74.8 |
62.9 |
11.9 |
|
Biotechnology |
28.1 |
34.1 |
(6.0) |
Europe |
9.5 |
17.4 |
(7.9) |
|
Healthcare providers/services |
15.6 |
7.2 |
8.4 |
Emerging markets |
9.3 |
12.1 |
(2.8) |
|
Healthcare equip/supplies |
14.9 |
16.0 |
(1.1) |
Developed Asia |
6.4 |
7.6 |
(1.2) |
|
Life science tools & services |
4.8 |
4.1 |
0.7 |
|||||
Emerging markets baskets |
2.8 |
5.9 |
(3.1) |
|||||
Fixed & variable interest |
1.6 |
2.4 |
(0.8) |
|||||
Other baskets |
0.4 |
0.2 |
0.2 |
|||||
100.0 |
100.0 |
100.0 |
Source: Worldwide Healthcare Trust, Edison Investment Research
Polischuk is mindful that within the large-cap pharma sector, there are pockets of growth and innovation, but some companies have a series of ‘me-too’ products in their portfolios. He highlights WWH’s holdings in Takeda Pharmaceutical and Bayer as having particular upside potential, believing their shares are completely mispriced. For Takeda, Polischuk is confident the acquisition of UK-based Shire will transform the operation from a Japanese to a global company with a much-improved margin structure. Bayer’s share price has been depressed by litigation concerns about Roundup weedkiller, which became part of the company’s portfolio following the acquisition of Monsanto. The manager suggests Bayer has the widest spread between its long-term growth potential and current valuation within the large-cap pharma space.
Performance: Recent blip in strong long-term record
Polischuk says that WWH’s performance was strong in the first half of 2018 – sector allocation was positive, in terms of being overweight emerging biotech stocks, which outperformed the broader healthcare sector; underweight pharma stocks, which underperformed; and overweight in emerging markets, which performed relatively better. Also, there was a positive contribution from stock selection in the healthcare devices sector. However, the manager says that everything changed in Q318, when there was a shift into the pharma sector. Polischuk said these stocks rallied by c 15% in the quarter, which was the second-largest quarterly move this century. WWH’s performance was negatively affected by the significant fall in emerging market stocks, sparked by an escalation in the US’s protectionist trade policies. The manager says the whole healthcare sector then suffered from a sell-off in global equity markets in October 2018, with emerging market stocks performing particularly poorly, although pharma stocks were relatively resilient. This affected both WWH’s absolute and relative performance during the month.
|
Exhibit 4: Investment trust performance to 31 October 2018 |
|
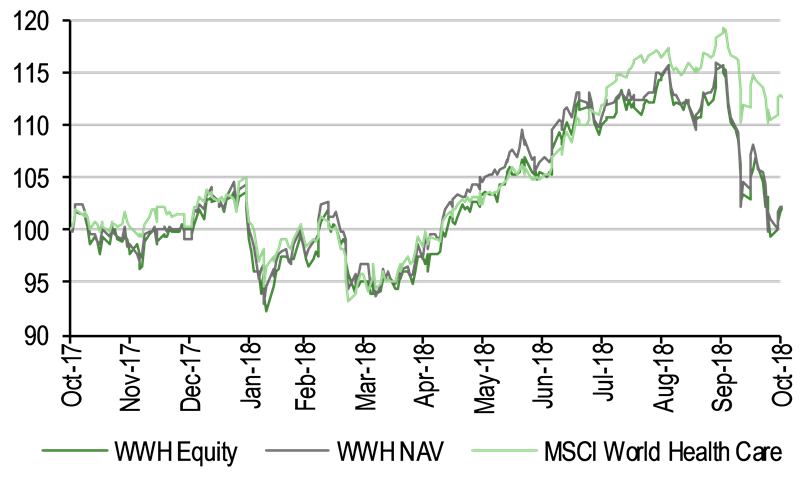
Price, NAV and benchmark total return performance, one-year rebased |
Price, NAV and benchmark total return performance (%) |
|
|
|
Source: Thomson Datastream, Edison Investment Research. Note: Three, five and 10-year performance figures annualised. Benchmark is DS World Pharma & Biotech index until 30 September 2010 and MSCI World Health Care index thereafter. |
|
The recent weakness in WWH’s performance has also affected its medium-term record. However, the trust has outperformed the benchmark in both NAV and share price terms over five and 10 years. Polischuk highlights WWH’s long-term record of outperformance, while noting its excess returns do not accumulate in a straight line. He is confident that he, Borho and the rest of the OrbiMed team will be able to build on WWH’s positive relative and absolute long-term record.
|
Exhibit 5: Share price and NAV total return performance, relative to indices (%) |
||||||||
|
One month |
Three months |
Six months |
One year |
Three years |
Five years |
10 years |
|
Price relative to MSCI World Health Care |
(7.4) |
(8.4) |
(9.0) |
(9.9) |
(0.8) |
12.3 |
41.0 |
|
NAV relative to MSCI World Health Care |
(7.5) |
(8.5) |
(8.1) |
(9.4) |
(5.5) |
7.8 |
26.0 |
|
Price relative to World-DS Pharm & Bio |
(7.3) |
(7.0) |
(7.0) |
(7.3) |
8.4 |
24.0 |
52.9 |
|
NAV relative to World -DS Pharm & Bio |
(7.3) |
(7.1) |
(6.2) |
(6.7) |
3.3 |
19.0 |
36.7 |
|
Price relative to FTSE All-Share |
(6.9) |
(0.4) |
8.1 |
3.2 |
15.6 |
73.1 |
133.4 |
|
NAV relative to FTSE All-Share |
(6.9) |
(0.6) |
9.1 |
3.8 |
10.2 |
66.0 |
108.6 |
|
|
Source: Thomson Datastream, Edison Investment Research. Note: Data to end-September 2018. Geometric calculation. |
||||||||
|
Exhibit 6: NAV total return performance relative to benchmark over 10 years |
||||||||
|
||||||||
|
Source: Thomson Datastream, Edison Investment Research |
||||||||
Discount: Trading in a narrow range
Since mid-2017, WWH’s shares have traded close to net asset value. The trust is currently trading at a 1.9% premium to its cum-income NAV (versus a range of a 4.5% premium to a 1.5% discount over the last 12 months), compared with an average 0.5% premium over the last year, average discounts of 2.2%, 2.9% and 5.2% over the last three, five and 10 years respectively. The board aims to keep the discount below 6%; it has the authority, renewed annually, to repurchase up to 14.99% and allot up to 10% of issued capital. So far in FY19, 1.8m shares (3.6% of the end-FY18 share base) have been allotted, raising gross proceeds of c £46m (Exhibit 1).
|
Exhibit 7: Share price premium/discount to NAV (including income) over three years (%) |
|
|
Source: Thomson Datastream, Edison Investment Research |
Capital structure and fees
WWH is a conventional investment trust with one class of share; there are currently 51.7m ordinary shares in issue. The trust has an overdraft facility with JP Morgan Chase, and is permitted to gear up to 20% of net assets (net gearing was 10.5% at end-October 2018). OrbiMed is paid a management fee of 0.65% of NAV, with a performance fee of 15% of outperformance versus the benchmark payable for incremental outperformance since launch, if it has been maintained for a 12-month period. Frostrow Capital, WWH’s Alternative Investment Fund Manager, is paid an annual management fee on a sliding scale: 0.3% up to £150m market cap; 0.2% from £150 to £500m; 0.15% from £500m to £1bn; 0.125% from £1bn to £1.5bn; and 0.075% over £1.5bn. It also receives a fixed fee of £57,500 pa. WWH’s ongoing charges in FY18 were 0.9% (1.2% including performance fees) versus 0.9% in FY17 (1.0% including performance fees).
Dividend policy and record
WWH pays twice-yearly dividends in January and July. The FY18 annual dividend of 17.5p was c 22% lower than 22.5p in FY17, while net revenue returns were c 15% lower year-on-year, partly due to a stronger pound versus the dollar during the period. At end-FY18, WWH had revenue reserves of £12.4m (equivalent to c 1.4x the last annual dividend). Although the trust’s primary aim is capital growth rather than income, it currently offers a 0.7% dividend yield.
Peer group comparison
Exhibit 8 shows the members of the AIC Sector Specialist: Biotechnology & Healthcare sector along with BB Biotech and HBM Healthcare, which are listed in Switzerland. WWH’s NAV total returns are above average over three, five and 10 years, while trailing over one year. The trust’s ongoing charge is lower than average, as is its dividend yield, which is not unexpected given WWH does not have a high distribution policy, unlike some of its peers.
Exhibit 8: Selected peer group as at 21 November 2018*
% unless stated |
Market cap £m |
NAV TR |
NAV TR |
NAV TR |
NAV TR |
Discount (cum-fair) |
Ongoing charge |
Perf. |
Net |
Dividend yield (%) |
Worldwide Healthcare Trust |
1,319.8 |
1.5 |
31.9 |
110.6 |
454.4 |
1.2 |
0.9 |
Yes |
111 |
0.7 |
BB Biotech |
2,678.6 |
(6.2) |
7.7 |
124.7 |
531.2 |
11.5 |
1.3 |
No |
103 |
5.4 |
BB Healthcare Trust |
437.2 |
15.4 |
|
|
|
7.2 |
1.3 |
No |
108 |
2.8 |
Biotech Growth Trust |
366.2 |
(9.9) |
(4.5) |
59.2 |
536.5 |
(5.5) |
1.1 |
Yes |
108 |
0.0 |
HBM Healthcare Investments |
997.6 |
18.4 |
75.0 |
165.6 |
231.1 |
(7.2) |
1.2 |
Yes |
100 |
4.3 |
International Biotechnology Trust |
218.9 |
0.6 |
8.5 |
99.1 |
339.2 |
(0.3) |
1.1 |
Yes |
100 |
4.7 |
Polar Capital Global Healthcare |
265.8 |
13.0 |
32.2 |
68.4 |
|
(4.7) |
1.4 |
Yes |
100 |
0.9 |
Syncona |
1,785.3 |
22.1 |
62.3 |
82.2 |
|
29.7 |
1.0 |
No |
100 |
0.9 |
Average (eight funds) |
1,008.7 |
6.9 |
30.4 |
101.4 |
418.5 |
4.0 |
1.2 |
104 |
2.4 |
|
WWH rank in peer group |
3 |
5 |
4 |
3 |
3 |
4 |
8 |
1 |
7 |
Source: Morningstar, Edison Investment Research. Note: *Performance data to 20 November. TR = total return. Net gearing is total assets less cash and equivalents as a percentage of net assets (100 = ungeared).
The board
WWH’s board has six directors, five of whom are non-executive and independent of the manager: Sir Martin Smith (chairman since 2008, appointed in 2007); Dr David Holbrook (senior independent director, appointed in 2007); Doug McCutcheon (appointed in 2012); Sarah Bates (appointed in 2013); and Humphrey van der Klugt (appointed in 2016). The non-independent director is Sven Borho, one of WWH’s lead managers, and a founder and managing partner of OrbiMed. He was appointed in June 2018 following the resignation of WWH’s former lead manager, Sam Isaly, in January 2018.
|
|
Research: Healthcare
Photocure has announced results for Q318, with 25% revenue growth compared to Q317. Revenues grew strongly in the US, where Hexvix/Cysview sales increased 46% over Q317. This was driven mainly by improved reimbursement and a higher installed base of blue light cystoscopes. Importantly, the company has received new medicare coding, which will increase reimbursement for the use of Hexvix/Cysview starting in 2019.