Last close As at 05/08/2026
CHF50.70
▲ 0.20 (0.40%)
Market capitalisation
CHF681m
Research: Healthcare
Basilea announced strong H123 results, including revenues for Cresemba, and in August submitted a new drug application (NDA) to the US FDA for Zevtera. The company continues to engage in discussions with potential (in-licensing and acquisition) partners with the aim of re-filling the clinical development pipeline to bolster its portfolio of anti-infectives. Total Cresemba- and Zevtera-related revenue was CHF80.5m in H123 and grew by 57.2% from the previous year. We increase our valuation for Basilea to CHF797.8m or CHF66.6 per share (from CHF785.0m or CHF65.7 per share previously), largely driven by reduced net debt, foreign exchange considerations and rolling our model forward.
Written by
Basilea Pharmaceutica |
A strong start to FY23 across the board |
H123 update |
Pharma and biotech |
17 August 2023 |
Share price performance
Business description
Next events
Analysts
Basilea Pharmaceutica is a research client of Edison Investment Research Limited |
|||||||||||||||||||||||||||||||||||||||||||||||||||||||
Basilea announced strong H123 results, including revenues for Cresemba, and in August submitted a new drug application (NDA) to the US FDA for Zevtera. The company continues to engage in discussions with potential (in-licensing and acquisition) partners with the aim of re-filling the clinical development pipeline to bolster its portfolio of anti-infectives. Total Cresemba- and Zevtera-related revenue was CHF80.5m in H123 and grew by 57.2% from the previous year. We increase our valuation for Basilea to CHF797.8m or CHF66.6 per share (from CHF785.0m or CHF65.7 per share previously), largely driven by reduced net debt, foreign exchange considerations and rolling our model forward.
Year end |
Revenue |
PBT* |
EPS* |
DPS |
P/E |
Yield |
12/21 |
148.1 |
(6.6) |
(56.9) |
0.0 |
N/A |
N/A |
12/22 |
147.8 |
12.3 |
104.1 |
0.0 |
45.5 |
N/A |
12/23e |
158.2 |
43.5 |
332.2 |
0.0 |
14.3 |
N/A |
12/24e |
180.7 |
63.2 |
482.3 |
0.0 |
9.8 |
N/A |
Note: *PBT and EPS are normalised, excluding amortisation of acquired intangibles, exceptional items and share-based payments.
Cresemba payments continue to support revenues
Basilea’s lead product Cresemba continues to impress, with the antifungal therapy bringing increased milestone and royalty payments. The company received multiple milestone payments of CHF30.6m (versus CHF2.2m in H122) based on in-market sales from established markets. Cresemba royalties increased by 27% from the prior year to CHF36.7m, highlighting increased market penetration. We expect Cresemba sales to continue to drive top-line revenues with the recent launches in Japan and China, which management believes represent 25% of the global potential.
Next key catalyst: US regulatory decision on Zevtera
In August 2023, Basilea announced that it had submitted an NDA for Zevtera to the US FDA. Approval in the US will allow it to address the majority of the anti-MRSA market opportunity as the country represents more than 80% of the global antiMRSA antibiotics sales. Management expects a decision from the FDA in Q224, representing a major catalyst in our view. Basilea is also seeking a commercialisation partner for Zevtera in the US, which it aims to secure ahead of the regulatory decision.
Valuation: CHF797.8m or CHF66.6 per share
We adjust our valuation for Basilea to CHF797.8m or CHF66.6 per share, from CHF785.0m or CHF65.7 per share previously. The adjustment was mainly driven by the combined effects of improved net debt of CHF38.1m at end June 2023, foreign exchange changes and rolling our model forward. Based on Basilea’s H123 results, we have made minor alterations to our FY23 estimates, although our long-term assumptions are unchanged.
Sustained success for Cresemba
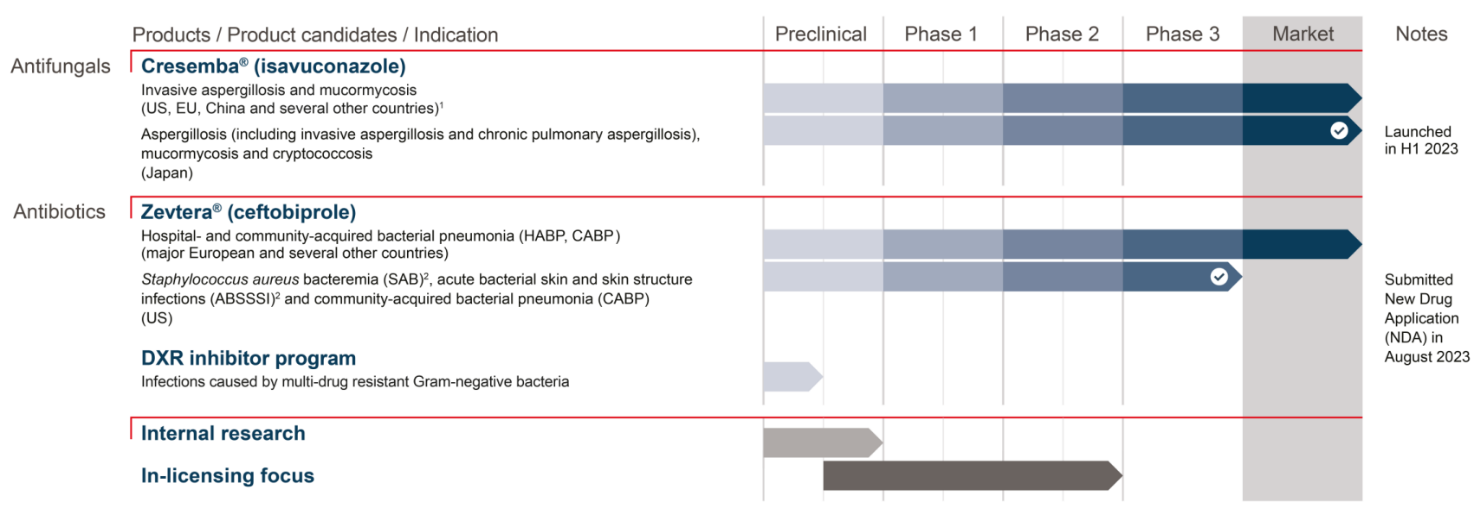
Heading Basilea’s portfolio of products is Cresemba (Exhibit 1), an intravenous and oral antifungal therapy for the treatment of life-threatening, invasive mould infections. Cresemba has been approved in 73 countries, is marketed in 67 countries and has orphan drug designation in the US, Europe and Australia. Sustained market appetite is driving continued sales momentum. H123 saw the successful launch of Cresemba in Japan, which we expect will contribute to a material sales push in H223. Additionally, we note that the company is planning to submit paediatric study data to EU regulatory authorities, which could extend Cresemba’s market exclusivity by two years to October 2027 in this region; the submission is planned for H223. A paediatric label extension is also planned for the US, with the potential to extend market exclusivity in the US by six months to September 2027.
|
Exhibit 1: Basilea’s portfolio of anti-infectives |
|
|
Source: Basilea investor presentation, August 2023 |
Milestone and royalty payments drive revenues in H123
As recorded in Basilea’s FY22 results, sales of Cresemba meant the company achieved profitability sooner than expected, and this positive newsflow has continued throughout H123. In the first half of the year, Basilea reported a CHF20m milestone payment from partner Astellas for strong sales in the US (accounted in FY22 as milestone payment was based on FY22 sales), three further milestone payments totalling US$27.5m from Pfizer triggered by sales across Asia-Pacific, China and Europe, along with an additional CHF5m from Asahi Kasei Pharma for the launch of Cresemba in Japan. We note that the company expects about CHF33-34m in milestone payments in FY23, out of which CHF30.6m has already been recognised in H123. It is our opinion that, collectively, these milestone payments covering various regions highlight the commercial success of the antifungal therapy worldwide. Furthermore, Basilea also received CHF36.7m in Cresemba-associated sales royalties, marking a 27% year-on-year increase. In our view, this reflects impressive progress and demonstrates that Cresemba is playing an effective role in addressing an important medical need.
Cresemba market share is growing
In terms of value, Cresemba has become the market leader in the US (Exhibit 2). We note that it has a market share of 36% (according to IQVIA data, March 2023, as cited by Basilea) compared to competitor best-in-class antifungal therapies posaconazole, voriconazole, AmBisome, anidulafungin, caspofungin and micafungin. This has increased from 31% at end FY22, representing encouraging growth, in our view, as the US remains a key market. In terms of global sales, Cresemba has captured 14% of this wider market (according to IQVIA, March 2023, as cited by Basilea), up from 12% at end FY22 (Exhibit 3). We anticipate that this trend will continue through H223, as the company sees increasing contributions from China and Japan, for which Cresemba gained regulatory approvals in FY22. Management believes that these regions represent c 25% of the global market opportunity for Cresemba.
|
Exhibit 2: Cresemba US market share |
Exhibit 3: Cresemba global market share |
|
|
|
Source: Basilea investor presentation, August 2023 |
|
Exhibit 2: Cresemba US market share |
|
|
Source: Basilea investor presentation, August 2023 |
|
Exhibit 3: Cresemba global market share |
|
|
Source: Basilea investor presentation, August 2023 |
Approval of Zevtera in the US represents a key focus
Zevtera (ceftobiprole) is an intravenous antibiotic medication that has demonstrated rapid bactericidal activity against various Gram-positive bacteria such as Staphylococcus aureus (including methicillin-resistant strains, MRSA) and Gram-negative bacteria. While Zevtera is already marketed in selected countries in Europe, Latin America, the Middle East and North Africa, and Canada, the approval of Zevtera in the US is a key strategic priority for Basilea. This could represent a potentially lucrative commercial opportunity, as the global MRSA treatment market is predicted to be worth c $5.5bn by 2030 and with the US accounting for the majority of global anti-MRSA antibiotics by revenue (c 85%, according to IQVIA, March 2023).
US NDA submitted to the FDA for Zevtera
Post-period, in August 2023, Basilea announced that it had submitted an NDA for Zevtera to the US FDA. This came after a minor delay with one of the company’s contract manufacturing organisations requiring additional time to adapt its quality control systems prior to FDA inspection, a prerequisite for NDA review. We note that the FDA previously granted qualified infectious disease product (QIDP) designation to Zevtera, and hence the NDA is eligible for priority review (ie within eight months of submission). Therefore, Basilea expects a decision from the FDA in Q224, on track for a potential launch date for Zevtera in H224. We also note that Basilea plans to commercialise Zevtera in the US with a licensing partner, which management hopes to have signed before the regulatory decision. Furthermore, if approved by the FDA, the QIDP designation enables up to 10 years of market exclusivity in the US, representing a potentially lucrative opportunity, in our view.
Supported by three Phase III trials for three indications
For Zevtera, Basilea is seeking FDA approval for three indications: Staphylococcus aureus bacteraemia (SAB), acute bacterial skin and skin structure infections (ABSSSI) and community-acquired bacterial pneumonia (CABP). Hence, the IND submission is supported by positive results from three Phase III clinical trials: the ERADICATE study for SAB, the TARGET study for ABSSSI, and a Phase III study in CABP. In our view, these trial outcomes contribute to a strong data package for Zevtera in these indications, and we believe that the outcome of the regulatory decision could represent a significant catalyst for the company.
Valuation
Our valuation for Basilea increases to CHF797.8m or CHF66.6 per share, from CHF785.0m or CHF65.7 per share previously, mainly due to the combined effects of reduced net debt to CHF38.1m at end June 2023 (CHF46.7m at end-FY22), foreign exchange changes and rolling forward our estimates. Our long-term assumptions for Basilea are unchanged.
Exhibit 4: Basilea Pharmaceutica valuation
Product |
Indication |
Launch |
Peak sales |
NPV |
Probability |
rNPV |
rNPV/share (CHF) |
Cresemba (isavuconazole) |
Severe fungal infections |
2015 (US); 2016 (EU); 2018 (RoW); 2022 (China): 2023 (Japan) |
691 |
672.3 |
85–100% |
652.3 |
54.5 |
Zevtera/Mabelio (ceftobiprole) |
Severe bacterial infections |
2015 (EU); 2018 (RoW); 2024 (US) |
581 |
205.6 |
85–100% |
183.6 |
15.3 |
Net debt at end June 2023 |
|
|
(38.1) |
100% |
(38.1) |
(3.2) |
|
Valuation |
|
|
|
839.7 |
|
797.8 |
66.6 |
Source: Edison Investment Research
Financials
In H123, Basilea reported revenue growth of 47.3% y-o-y to CHF84.9m, mainly driven by higher revenue related to Cresemba and Zevtera sales. Total Cresemba- and Zevtera-related revenue stood at CHF80.5m in H123, 57.2% y-o-y growth, and was primarily associated with CHF36.7m in royalty income from Cresemba (27.0% y-o-y growth) and CHF30.6m from milestone payments (versus CHF2.2m in H222). Other revenue (including R&D reimbursements from BARDA) declined to CHF4.4m in H123 from CHF6.5m in H222, as the Zevtera Phase III study concludes, indicated by the recent NDA submission.
While cost of goods sold was down 33.0% y-o-y in H123, operating expenses excluding COGS decreased by 28.0% y-o-y in H123 to CHF38.0m. The decline in operating expenses was mainly driven by reduced R&D expenses, down by 42.2% y-o-y, reflecting decreased clinical activities related to the Zevtera Phase III programme and discontinuation of the oncology clinical programmes in FY22. SG&A expenses recorded a moderate increase of 5.9% to CHF16.5m in H123 (versus CHF15.6m in H122). All these developments resulted in Basilea reporting an operating profit of CHF36.9m in H123, compared to an operating loss of CHF10.0m in H122. Cash flow from operations for the period was CHF21.9m, contributing to cash and cash equivalents and restricted cash of CHF112.9m at end H123. At 30 June 2023, Basilea’s debt position stood at CHF151.1m including 2027 convertible senior unsecured bonds and a senior secured loan.
Along with the H123 results, Basilea has provided revised guidance for FY23. It now expects revenue to grow by 20–23% to CHF147–150m in FY23 (versus CHF145–148m previously). Operating profit and net profit guidance for FY23 is CHF50–55m (CHF45–50m previously) and CHF41–46m (CHF36–41m previously), respectively. Based on the new guidance, we have made minor adjustments to our estimates. We have slightly increased our revenue estimates for FY23 to CHF158.2m from CHF156.7m previously. Additionally, we have slightly adjusted our R&D estimate to CHF50.4m from CHF51.7m previously, resulting in operating expenses (ex-COGS) of CHF79.6m, in line with management guidance of c CHF80m. These changes translate into an operating profit of CHF51.7m in FY23 and net profit of CHF43.3m in FY23, again in line with company guidance. Similar to FY23, we have slightly revised down our FY24 R&D estimate to CHF47.9m from CHF49.1m previously, which is reflected in improved operating profit and net profit estimates of CHF67.2m and CHF63.0m from CHF66.0m and CHF61.8m previously.
Exhibit 5: FY23 Corporate guidance
CHFm |
New FY23 guidance |
Old FY23 guidance |
Cresemba- and Zevtera-related revenue |
147–150 |
145–148 |
Royalty income |
c 76 |
c 74 |
Total revenue |
157–160 |
155–158 |
Cost of products sold |
25–27 |
25–28 |
Operating expenses |
c 80 |
c 80 |
Operating profit |
50–55 |
45–50 |
Net profit |
41–46 |
36–41 |
Source: Basilea investor presentation, August 2023
Exhibit 6: Financial summary
Accounts: US GAAP, year-end: 31 December, CHF000s |
|
|
2021 |
2022 |
2023e |
2024e |
PROFIT & LOSS |
|
|
|
|
|
|
Total revenues |
|
|
148,122 |
147,765 |
158,202 |
180,737 |
Product revenues (Cresemba and Zevtera) |
|
|
131,382 |
122,315 |
148,202 |
180,737 |
Cost of sales |
|
|
(24,072) |
(24,603) |
(26,851) |
(33,746) |
Gross profit |
|
|
124,050 |
123,162 |
131,351 |
146,991 |
Research and development expenses (net) |
|
|
(93,157) |
(73,804) |
(50,405) |
(47,885) |
SG&A costs |
|
|
(29,721) |
(30,815) |
(29,260) |
(31,933) |
Other income/(expense) |
|
|
0 |
0 |
0 |
0 |
Exceptionals and adjustments |
|
|
15 |
0 |
0 |
0 |
EBITDA (reported) |
|
|
1,941 |
19,640 |
52,438 |
67,968 |
Reported operating income |
|
|
1,187 |
18,543 |
51,685 |
67,173 |
Operating margin % |
|
|
N/A |
N/A |
N/A |
N/A |
Finance income/(expense) |
|
|
(7,982) |
(6,441) |
(8,369) |
(4,207) |
Exceptionals and adjustments |
|
|
0 |
0 |
0 |
0 |
Profit before tax (reported) |
|
|
(6,795) |
12,102 |
43,317 |
62,966 |
Profit before tax (normalised) |
|
|
(6,610) |
12,302 |
43,517 |
63,173 |
Income tax expense (includes exceptionals) |
|
|
(37) |
45 |
0 |
0 |
Net income (reported) |
|
|
(6,832) |
12,147 |
43,317 |
62,966 |
Net income (normalised) |
|
|
(6,647) |
12,347 |
43,517 |
63,173 |
Basic average number of shares, m |
|
|
11.68 |
11.86 |
13.10 |
13.10 |
Basic EPS (CHF c) |
|
|
(58.5) |
102.4 |
330.7 |
480.7 |
Adjusted EPS (CHF c) |
|
|
(56.9) |
104.1 |
332.2 |
482.3 |
Dividend per share (CHF c) |
|
|
0 |
0 |
0 |
0 |
BALANCE SHEET |
|
|
|
|
|
|
Restricted cash |
|
|
0 |
22,000 |
22,000 |
22,000 |
Tangible assets |
|
|
2,018 |
4,277 |
6,985 |
9,597 |
Intangible assets |
|
|
632 |
578 |
578 |
571 |
Long-term investments |
|
|
2,390 |
1,266 |
1,266 |
1,266 |
Other non-current assets |
|
|
1,161 |
17,363 |
17,363 |
17,363 |
Total non-current assets |
|
|
6,201 |
45,484 |
48,192 |
50,797 |
Cash and equivalents |
|
|
53,700 |
84,659 |
98,761 |
117,604 |
Short-term investments |
|
|
95,000 |
0 |
0 |
0 |
Inventories |
|
|
22,783 |
24,244 |
26,459 |
33,254 |
Trade and other receivables |
|
|
24,947 |
33,152 |
35,494 |
40,549 |
Other current assets |
|
|
44,636 |
33,309 |
33,309 |
33,309 |
Total current assets |
|
|
241,066 |
175,364 |
194,023 |
224,716 |
Convertible senior unsecured bonds (long-term) |
|
|
94,544 |
95,000 |
95,000 |
95,000 |
Senior secured loan |
|
|
0 |
36,360 |
0 |
0 |
Deferred revenue |
|
|
11,926 |
10,693 |
10,693 |
10,693 |
Non-current operating lease liabilities |
|
|
10 |
16,323 |
16,323 |
16,323 |
Other non-current liabilities |
|
|
24,986 |
8,337 |
8,337 |
8,337 |
Total non-current liabilities |
|
|
131,466 |
166,713 |
130,353 |
130,353 |
Convertible senior unsecured bonds (short-term) |
|
|
123,505 |
0 |
0 |
0 |
Senior secured loan |
|
|
0 |
37,467 |
36,360 |
0 |
Accounts payable |
|
|
10,617 |
191 |
12,050 |
15,144 |
Deferred revenue |
|
|
1,233 |
1,233 |
1,233 |
1,233 |
Current operating lease liabilities |
|
|
896 |
1,988 |
1,988 |
1,988 |
Other current liabilities |
|
|
38,157 |
33,971 |
33,971 |
33,971 |
Total current liabilities |
|
|
174,408 |
74,850 |
85,602 |
52,336 |
Net assets |
|
|
(58,607) |
(20,715) |
26,260 |
92,824 |
CASH FLOW STATEMENT |
|
|
|
|
|
|
Reported net income |
|
|
(6,831) |
12,147 |
43,317 |
62,966 |
Depreciation and amortisation |
|
|
754 |
1,097 |
753 |
795 |
Share based payments |
|
|
4,322 |
3,598 |
3,598 |
3,598 |
Other adjustments |
|
|
1,522 |
497 |
0 |
0 |
Movements in working capital |
|
|
(31,787) |
(10,282) |
7,302 |
(8,756) |
Cash from operations (CFO) |
|
|
(32,020) |
7,057 |
54,970 |
58,603 |
Capex |
|
|
(581) |
(3,138) |
(3,200) |
(3,200) |
Short-term investments |
|
|
6,023 |
94,951 |
0 |
0 |
Long-term investments |
|
|
0 |
0 |
0 |
0 |
Other investing activities |
|
|
(1,867) |
(165) |
(200) |
(200) |
Cash used in investing activities (CFIA) |
|
|
3,575 |
91,648 |
(3,400) |
(3,400) |
Net proceeds from issue of shares |
|
|
42,240 |
250 |
0 |
0 |
Movements in debt |
|
|
(23,212) |
(49,672) |
(37,467) |
(36,360) |
Other financing activities |
|
|
(2,388) |
4,176 |
0 |
0 |
Cash from financing activities (CFF) |
|
|
16,640 |
(45,246) |
(37,467) |
(36,360) |
Cash and equivalents at beginning of period |
|
|
66,256 |
54,952 |
108,566 |
122,669 |
Increase/(decrease) in cash and equivalents |
|
|
(11,805) |
53,459 |
14,103 |
18,843 |
Effect of FX on cash and equivalents |
|
|
501 |
155 |
0 |
0 |
Cash and equivalents at end of period |
|
|
54,952 |
108,566 |
122,669 |
141,512 |
Net (debt)/cash |
|
|
(69,349) |
(46,701) |
3,761 |
22,604 |
Source: Company reports, Edison Investment Research
|
|
Research: TMT
CentralNic’s H123 results showed continuing revenue growth and margin expansion, with growth now being driven more organically and across both operating segments. Partnerships could be key to unlocking growth from underutilised brands, with management winning several notable deals during the period. Our operational forecasts remain unchanged, with increases in EPS and net debt reflecting the recent £30m uplift to the share buyback programme. We believe that the current rating does not reflect the company’s cash generative mode and diverse growth prospects.