Princess Private Equity Holding — Strong flow of attractive deals in FY18

Princess Private Equity Holding (LSE: PEY)

Last close As at 27/03/2024

EUR10.90

0.00 (0.00%)

Market capitalisation

EUR754m

More on this equity

Research: Investment Companies

Princess Private Equity Holding — Strong flow of attractive deals in FY18

Princess Private Equity Holding (PEY) recorded a particularly high level of investment activity in FY18 (to 31 December), following on from a record year of realisations in FY17. The fund focuses on profitable companies with: a consistent track record of EBITDA growth (an average of 11.5% for 2018 across the whole portfolio); meaningful growth potential, supported by strong competitive positions in growing end markets; and clear scope for manager Partners Group’s industry value creation (IVC) team to add value through operational and governance improvements. PEY’s NAV total return for FY18 was 6.8%, a c 10pp outperformance of global listed equity markets, and although the share price total return for the year was negative as a result of the sharp sell-off in public markets in Q418, it has rebounded by more than 10% year to date (to 1 March). PEY has a high distribution policy and currently offers a dividend yield of 6.0%.

Analyst avatar placeholder

Written by

Investment Companies

Princess Private Equity Holding

Strong flow of attractive deals in FY18

Investment companies

4 March 2019

Price

€9.31

Price (PEYS)

819p

Market cap

€643.8m

AUM

€759.3m

NAV*

€10.98

Discount to NAV

15.2%

*As at 31 January 2019.

Yield

6.0%

Ordinary shares in issue

69.2m

Code

PEY/PEYS

Primary exchange

LSE

AIC sector

Private Equity

Share price/discount performance

Three-year performance vs index

52-week high/low

€10.55

€8.36

€11.44

€10.75

Gearing

Gross*

4.6%

Net*

0.7%

*As at 31 December 2018.

Analysts

Sarah Godfrey

+44 (0)20 3681 2519

Gavin Wood

+44 (0)20 3681 2503

Princess Private Equity Holding (PEY) recorded a particularly high level of investment activity in FY18 (to 31 December), following on from a record year of realisations in FY17. The fund focuses on profitable companies with: a consistent track record of EBITDA growth (an average of 11.5% for 2018 across the whole portfolio); meaningful growth potential, supported by strong competitive positions in growing end markets; and clear scope for manager Partners Group’s industry value creation (IVC) team to add value through operational and governance improvements. PEY’s NAV total return for FY18 was 6.8%, a c 10pp outperformance of global listed equity markets, and although the share price total return for the year was negative as a result of the sharp sell-off in public markets in Q418, it has rebounded by more than 10% year to date (to 1 March). PEY has a high distribution policy and currently offers a dividend yield of 6.0%.

12 months ending

Share price
(%)

NAV
(%)

LPX Europe
(%)

LPX Europe NAV (%)

MSCI World
(%)

FTSE All-Share (%)

31/01/15

20.5

16.1

20.3

15.4

28.6

17.0

31/01/16

15.1

13.2

4.9

6.5

(0.5)

(6.1)

31/01/17

29.7

15.3

22.5

8.5

18.0

6.6

31/01/18

14.6

10.2

21.5

14.2

9.8

9.1

31/01/19

(2.2)

7.4

(8.6)

8.8

2.0

(3.4)

Source: Refinitiv. Note: All % on a total return basis in euros.

Investment strategy: Adding value in the mid-market

PEY invests mainly in direct private equity deals sourced by its investment adviser, Partners Group, as well as making co-investments and holding senior and subordinated debt. It aims to hold a diversified portfolio, principally made up of 50–80 private equity stakes. Partners Group focuses on medium-sized businesses with strong competitive positions in attractive market niches. Through its IVC team, it seeks to add value to investee companies. PEY has a legacy portfolio of third-party funds (13% of NAV) that are largely in the process of returning capital.

Market outlook: Shares rebound despite uncertainty

After a sharp sell-off in listed asset markets in late 2018, the early part of this year has seen something of a rebound. This has benefited the share prices of listed private equity funds, with the value of their assets largely having held up well during the volatility. Macroeconomic uncertainty remains, with global growth slowing amid a tightening of monetary conditions; however, a focus on quality companies with structural end-market demand could continue to benefit patient investors.

Valuation: High yield supports narrower discount

At 1 March 2019, PEY’s shares traded at a 15.2% discount to NAV. This was somewhat wider than the one- and three-year averages of 10.9% and 12.1%, respectively, but is broadly in line with the five-year average and substantially lower than the 12-month widest point of 24.5% reached in late December 2018. PEY’s tendency to trade at a narrower discount than some of its peers may be attributable to its policy of paying out a high distribution of 5–8% of NAV each year. The shares currently yield 6.0%.

Princess Private Equity Holding is a research client of Edison Investment Research Limited

Exhibit 1: Company at a glance

Investment objective and fund background

Recent developments

Princess Private Equity Holding is an investment holding company domiciled in Guernsey that invests in private equity and private debt. Its portfolio may include direct, primary and secondary fund investments. Princess aims to provide shareholders with long-term capital growth as well as an attractive dividend yield. The shares are traded on the Main Market of the London Stock Exchange.

22 November 2018: Results for the quarter ended 30 September 2018. NAV TR +3.4% and share price TR +4.0% (all in €). 9M18 NAV TR +9.3%.

16 October 2018: Second interim dividend of €0.28 declared in respect of year ending 31 December, payable on 14 December.

3 September 2018: As previously indicated, Brian Human stepped down as chairman of PEY with effect from 1 September and was succeeded by Richard Battey. Fionnuala Carvill and Merise Wheatley were also appointed as non-executive directors.

Forthcoming

Capital structure

Fund details

AGM

May 2019

Ongoing charges

1.78% (FY17)

Group

Partners Group

Annual results

March 2019

Net gearing

0.7%

Manager

Team-managed

Year end

31 December

Annual mgmt fee

1.5%

Address

Tudor House, PO Box 477,
Guernsey, GY1 1BT

Dividend paid

June, December

Performance fee

See page 13

Launch date

1999 (listed since 2006)

Company life

Indefinite

Phone

+44 (0) 1481 711 690

Continuation vote

None

Loan facilities

€50m

Website

www.princess-privateequity.net

Dividend policy and history (financial years)

Share buyback policy and history (financial years)

PEY intends to pay a total annual dividend equivalent to c 5–8% of NAV per share, in two instalments.

Under an authority granted in 2010, PEY’s directors may buy back up to 14.99% of shares, or allot shares up to c 10% of the share capital, each year. However, no shares have been issued or repurchased since FY14.

Shareholder base (as at 13 November 2018)

Portfolio exposure by category (as at 31 December 2018)

Top 10 holdings (as at 31 January 2019)

Portfolio weight %

Company

Country

Sector

31 January 2019

31 January 2018**

Action

Western Europe

Consumer discretionary

8.4

7.8

Permotio Intl Learning

Western Europe

Consumer discretionary

7.5

5.5

Form Technologies (formerly Dynacast)

North America

Materials

4.6

4.7

Foncia

Western Europe

Financials

3.6

3.0

Fermaca

Rest of world

Energy

3.6

2.5

KinderCare Education

North America

Consumer discretionary

3.2

2.8

GlobalLogic

North America

Information technology

3.0

N/A

Hofmann Menue Manufaktur

Western Europe

Consumer staples

2.9

2.1

Hearthside Food Solutions

North America

Consumer staples

2.7

N/A

Techem Metering

Western Europe

Industrials

2.5

N/A

Top 10 (% of holdings)

42.0

35.1

Source: Princess Private Equity Holding, Edison Investment Research, Bloomberg, Morningstar. Note: *Special situations includes real estate and infrastructure investments. **N/A where not in end-January 2018 top 10.

Private markets background

Private equity is a form of funding that enables companies to access capital without seeking a stock market listing. Broadly, the finance available falls into three areas: venture capital, growth capital and buyout financing. Private debt broadly refers to non-bank lending to private companies, often medium-sized or smaller firms that have limited access to capital markets, and may be used to fund growth, add-on acquisitions, or ongoing business activities.

Direct private equity investment is usually undertaken by specialist firms, which may offer expertise as well as investment, helping to refocus or restructure businesses through operational and/or board involvement. These firms, known as general partners (GPs), may structure portfolios of their investments as a fund, typically with a fixed life and containing a mix of investee companies. Such funds are usually structured as limited partnerships and the investors in them are known as limited partners (LPs). Sometimes private equity investments may be sold in the market rather than being held by the GP until maturity; this is known as a secondary investment. The size of minimum investment required from an LP in an unlisted private equity fund puts these vehicles out of reach of most individual investors, although they may be accessed by pension funds and other institutional investors. Individual investors can access the asset class by investing in a listed private equity fund.

While the risks of investing in earlier-stage companies or those with a troubled history cannot be mitigated entirely, investing via a listed private equity fund – particularly one with a focus on buyouts with a track record of profitability and EBITDA growth – can give the smaller investor access to a more diversified portfolio, which benefits from a team of experienced investors selecting and monitoring the underlying holdings. The addition of private debt to a portfolio can boost returns on cash awaiting investment, as well as providing an alternative source of funding to portfolio companies. Listed private equity funds may make investments directly or in a portfolio of underlying funds (fund of funds); while PEY historically had more of a fund of funds approach, since 2011 it has focused increasingly on direct investments with Partners Group.

Fund profile: Diversified private equity & debt portfolio

Princess Private Equity Holding (PEY) is a Guernsey-registered investment company that began life in 1999, when it raised $700m via a convertible bond in order to make commitments to third-party managed private equity funds. In 2006, it converted the bond into shares, which were listed on the Frankfurt Stock Exchange. PEY gained an additional listing on the London Stock Exchange in 2007 and cancelled its Frankfurt listing in 2012, although its functional currency remains the euro. A sterling-denominated quote (PEYS) was added in September 2017.

The fund aims to achieve long-term capital growth for its shareholders, along with an attractive dividend yield (targeting 5–8% of NAV each year, paid in two instalments), by investing primarily in private equity, although it also makes private debt investments. The portfolio is managed by Partners Group, a Switzerland-headquartered global private markets specialist with c $83bn of assets under management. PEY changed its focus from third-party funds in 2011 and now invests mainly via Partners Group’s direct private equity investment programmes (funds), although it also makes co-investments with other managers. The remaining third-party funds (13% of the PEY portfolio at 31 December 2018) are now largely mature and in the process of returning cash to investors.

PEY is a member the Association of Investment Companies’ Private Equity sector. It has a borrowing facility of €50m which it uses to provide flexibility over the timing of investments. It also invests in liquid senior loans to assist with liquidity management. Unlike many of its peers, PEY does not tend to follow an overcommitment strategy. However, after a higher than usual pace of new investments in FY18, the portfolio is effectively fully invested, having previously had significant liquid resources (c $90m at end-FY17).

The fund manager: Partners Group

The manager’s view: Continued focus on active value creation

Felix Haldner, a director of PEY and a partner at Partners Group, comments that the portfolio continues to be very well diversified in terms of industry, geography and investment stage, with a clear focus on the mid-cap buyout segment of the market (59% of the portfolio at end-FY18) as well as some allocation to private debt (c 10%). Underlining this, he highlights two significant investments (one equity and one debt) made in the last quarter of the year.

Vishal Mega Mart was a €13.8m investment for PEY in November 2018. It is the franchisor of one of India’s largest value retail brands, and is also the wholesale supplier to the network of franchised Vishal Mega Mart hypermarkets, which stock a variety of branded general merchandise and food, alongside a private-label fast fashion range. Haldner explains that the Indian retail market remains very fragmented, with organised retail making up only c 9% of the total, leading to significant growth opportunities for the Vishal Mega Mart brand. The firm is led by a strong, execution-focused management team with a scalable model and Haldner says the stores offer an aspirational product mix, suited to India’s growing middle class. One of the company’s challenges is finding the right locations for expansion across second- and third-tier Indian cities, and Partners Group’s IVC team is assisting Vishal’s management in this trajectory, as well as maximising supply chain efficiency for the wholesale operation. Partners Group is the lead investor in the deal, but is working alongside local private equity specialist Kedaara, which Haldner says is particularly helpful in assisting Vishal Mega Mart to overcome some of the challenges of running a fast-growing business in India.

In October 2018, PEY invested €19.1m in the mezzanine debt of Envision Healthcare Holdings, supporting a private equity buyout of the company – which was previously publicly listed – by KKR. Envision is a provider of outsourced physician-led medical services and clinically based solutions, from patient transport to care in various settings. As with Vishal, the fragmented nature of the end market (in this case healthcare services in the US) offers opportunities for future growth, and as one of the largest players in its segment, Envision should be able to leverage the benefits of its scale through consolidation. Haldner says Partners Group has a strong relationship with KKR, a private equity-focused global investment manager with $195bn of assets under management. PEY participated in the complex transaction via an investment in a privately placed high-yield note, with similar terms to high-yield bonds and a target internal rate of return (IRR) of c 14%.

Looking ahead, Haldner says Partners Group’s core macroeconomic expectations are still for modest global growth, with gradually rising inflation in the US, but there is arguably more downside risk than upside potential in capital markets, as a result of monetary tightening and geopolitical uncertainty. Against such a backdrop, he says, the key for PEY is to concentrate on companies and industries with transformative tailwinds, and to focus on value creation through strong governance and the efforts of the IVC team. While the uncertain environment means holding periods could be longer, Haldner says PEY will continue to focus on realising assets where value creation has been achieved.

Asset allocation

Investment strategy

PEY invests in direct private equity transactions alongside other Partners Group-managed funds and accounts, and private debt investments overseen by Partners Group, as well as co-investing with other private equity managers (such as 3i, the lead investor in PEY’s largest holding, Action). Its primary focus is on mid-cap buyouts (enterprise value of c €500m–2bn) where Partners Group has a controlling or majority position, either as the lead investor or as co-lead with another private equity manager. PEY invests in these deals both through Partners Group’s flagship limited partner funds, and as a co-investor. Having previously invested in third-party private equity funds, this has not been a focus for PEY since 2011. While funds still account for 13% of the portfolio, these are mature investments that are now largely in the process of returning capital. Although it is less diversified than a private equity fund of funds (which may have exposure to hundreds of underlying companies), PEY does hold a diversified portfolio, targeting direct investments in c 50–80 companies in order to reduce the volatility of cash flows that might occur with a more concentrated strategy.

Partners Group is a relative value investor, meaning it looks at the pricing of investment opportunities in the context of both history and a relevant peer group. The manager seeks to make direct investments in companies that are highly cash-generative and/or offer meaningful top-line growth potential. In an environment of generally high prices for private equity deals, Partners Group has found it beneficial to focus on companies that fit into one or more of the following categories:

Platform companies: well-managed businesses that can be expanded via bolt-on acquisitions;

Category winners: companies with a strong competitive position in a growing market segment;

Defensive leaders: cash-generative businesses in market areas with high barriers to entry.

A fundamental part of the Partners Group private equity investment approach is its industry value creation team (see below), which it uses to help drive through initiatives to enable companies to strengthen their financial and competitive positions, and achieve their full potential.

Private debt investments serve two purposes: uninvested cash may be used to buy first-lien senior loans, which are highly liquid but offer higher returns than other near-cash investments, while second-lien or mezzanine investments are longer-term and may be used to gain exposure to favoured private companies that are not seeking additional equity financing. Partners Group is a conservative lender with a focus on capital preservation, seeking businesses with predictable cash flows, sustainable margins, a conservative capital structure and a stable record of historical performance. All PEY’s debt investments have floating rather than fixed rates of interest, which should be beneficial in a rising interest rate environment.

Investment process: Proactive approach to deal sourcing

Through its primary and secondary private equity teams, along with private debt and infrastructure teams, Partners Group maintains a detailed database of c 8,000 companies from which to source investment ideas. In total, the group has information on more than 20,000 businesses, relationships with c 800 private equity general partners, and representation on c 300 advisory boards. Every investment professional has a target list of companies that they would like to own if the opportunity arose and the team spends time speaking to company managements, working out an investment case, and identifying value creation potential and likely M&A targets. In addition, by providing debt finance, the group can build detailed knowledge of the operational and financial characteristics of private companies (where publicly available information may be scant), giving Partners Group’s investors an advantage in due diligence terms when these companies seek private equity financing.

Partners Group has a highly selective approach to investment, with less than 1% of potential deals on average (0.9% in FY18) making it into the group’s portfolios in any given year. The team screens around 1,000 deals each year (1,054 in FY18) on a high-level basis, looking at industry dynamics, market attractiveness, headline company financials, return potential, exit scenarios and how Partners Group could add value to the business. From this initial screen, c 1020% of potential deals (20.1% in FY18) are selected for initial due diligence, which assesses a range of quantitative and qualitative factors, and the most promising ideas (69 in FY18) are subjected to advanced due diligence, including in-depth financial modelling, scrutiny of legal terms and an assessment of environmental, social and governance (ESG) factors. Beyond checking on how a company measures up to various ESG metrics, the ESG team also comes up with positive drivers, identifying initiatives that can improve the profile of an asset in ESG terms, and ultimately create value.

Following the due diligence stage, the Partners Group team produces a detailed investment thesis, which includes an operational assessment by the IVC team, and creates a 100-day plan for execution of the deal and implementation of value creation initiatives. The final step of the process is a positive or negative investment recommendation. PEY made nine new direct private equity investments in FY18 (five with Partners Group as lead investor and four co-investments), broadly in line with historical averages. The fund aims to give exposure to c 5080 companies (not including holdings in legacy third-party funds).

PEY invests mainly through Partners Group’s flagship direct private equity funds, which are raised every three to four years. PEY makes commitments to these funds, and may also make direct ‘top-up’ investments alongside them. Funds may take time to draw down the funds committed to them at launch; the newest programme is Partners Group Direct Equity 2016, which is still in its investment period. In order to smooth out the pace of investment and avoid ‘cash drag’, which may occur when cash is returned to the portfolio (for example, as a result of realisations from legacy third-party funds) but is not drawn down by the direct funds, PEY may also make direct co-investments with other managers. As well as reducing cash drag, co-investments bring additional diversification to the portfolio, while reducing costs as they do not incur an extra layer of fund fees.

New private equity positions are typically 0.53.0% of NAV; PEY aims to express conviction in its investments and position sizes are ideally at least 2.0%. However, this depends to an extent on the apportionment of investments across Partners Group strategies, as allocations may be larger or smaller than targeted. During FY18, several new investments were large enough to be included in PEY’s top 10 holdings. PEY typically holds investments for three to five years. Where an exit comes as the result of a company listing on a stock market, the manager will usually aim to sell down the investment within two years (subject to any lock-ups), although listed companies may be held for longer if there is a strong investment case for doing so.

Partners Group closely monitors investee companies through its board representation, quarterly performance assessments, active engagement with stakeholders and the progress of value creation initiatives. Private equity investments are revalued quarterly (in March, June, September and December), although material changes that may affect the value of an investment will be factored in as they occur.

On the private debt side (c 10% of the portfolio at end-FY18), investments may be made directly by PEY or via Partners Group programmes. Second-lien or mezzanine debt investments target high single- to low double-digit returns, with typical holding periods of two to three years, while liquid first-lien loans are more short-term in nature and are held mainly as a higher-yielding alternative to cash.

PEY uses hedging instruments such as options and forward contracts to reduce the impact of currency fluctuations (primarily $/€) on the portfolio. As a result of this, FX neither contributed to nor detracted from returns for FY18 as a whole. At end-FY18, PEY’s portfolio currency exposure before and after hedging (post-hedging figures in brackets) was 57% euro (86%), 37% US dollar (11%), 5% sterling (2%), and 1% other (1%).

Industry value creation (IVC)

Partners Group sees its IVC team as a key differentiating factor in its – and by extension PEY’s – offering. Many private equity groups engage management consultants to drive through operational improvements at investee companies, but Partners Group’s IVC team is in-house. The team is made up of more than 30 senior executives and entrepreneurs, organised across six industry groups (healthcare, technology, media & telecoms [TMT], education, financial & business services, industrials, and consumer), as well as infrastructure and real estate. The IVC team is involved in the investment process from the earliest stage of deal sourcing, and a key factor in declining a potential investment would be where there is no clearly identifiable opportunity for the team to create value. Where initiatives can be identified, the IVC team draws up a 100-day plan from the point of investment, and creates a five-year roadmap. The team coaches and assists the management of investee companies in the implementation of projects, with all IVC work co-ordinated through a strategic project management office. Examples of current initiatives include the merger of recently purchased industrial belt manufacturers Megadyne and Ammeraal Beltech (now known as Ammega), consolidating the businesses in growing end markets, creating economies of scale, optimising the footprint, and improving distribution and cross-selling opportunities. With software developer GlobalLogic (a new investment in Q318), the Partners Group platform itself is a key driver of value creation, as other investee companies provide both a potential customer base and an additional source of distribution.

There are currently more than 200 value creation initiatives in progress across Partners Group’s 2012 and 2016 direct programmes (funds). PEY director Felix Haldner points out that the systematic value creation approach includes time and consideration taken in composing investee company boards, so that they are tailored to the company and the investment thesis. Partners Group has a large industrial partner network from which it sources non-executive directors and will usually appoint a chairman who has industry-relevant executive experience and can step in as an interim CEO if required.

Financial resources and commitments

PEY received a record level of distributions (€191.1m) from its portfolio in FY17 and started 2018 with net liquid resources of €88.3m (11.9% of NAV). However, after a higher than usual pace of investment activity during the summer (€62.1m in Q318, after adjusting for partial syndications of some deals to third-party investors), net liquidity had fallen to €17.3m (2.2% of NAV) at 30 September 2018, meaning the portfolio was essentially fully invested. For the first nine months of 2018, new investments totalled €128.1m, against €111.8m of distributions. The comparable figures for 9M17 are €80.9m of investments and €113.1m of distributions. At 31 December 2018, €35m of the €50m available credit line was drawn, leading to net liquidity of -€5m (net gearing of 0.7%). The credit line was used on a short-term basis to meet investment commitments; the borrowing was partly repaid in January 2019 and Haldner expects PEY to return to a small net cash position as distributions continue to be received from the legacy funds portfolio.

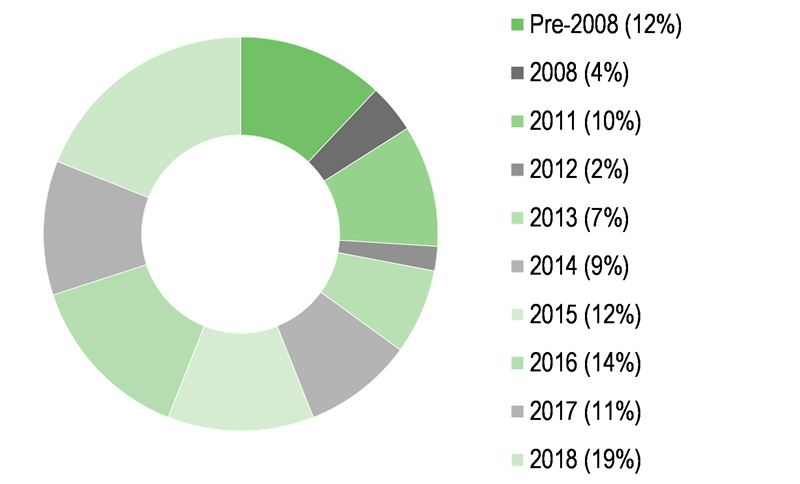
Exhibit 2: Investments and unfunded commitments by vintage

Current portfolio by investment year (%)

Unfunded commitments by fund/programme vintage (%)

Source: Princess Private Equity Holding, Edison Investment Research. Note: Data at end-December 2018.

Unfunded commitments at end-FY18 stood at €93.7m, including €16.5m to the Partners Group Direct Equity 2016 programme (down from €50m at end-FY17), €14.8m to the 2012 programme (unchanged on end-FY17), €2.2m to a 2011 mezzanine debt programme (€2.1m at end-FY17) and €21.7m of commitments to single-line direct investments (from €18.2m at end-FY17). Unfunded commitments to legacy third-party funds (PEY ceased new fund investments in 2011) stood at €38.5m (41% of total unfunded commitments), down from €39.0m at end-FY17. As shown in Exhibit 2 (right-hand chart), most of these commitments are to pre-2008 vintages, which are long past their initial investment period. Partners Group estimates that PEY’s €22.6m of commitments to pre-2007 vintages (24% of the total) are unlikely to be called, while the majority of the remaining €15.9m, if drawn, is likely to be accounted for by follow-on financing and fees.

Including the €15m (at end-FY18) undrawn borrowing facility and excluding the €22.6m of commitments that are deemed unlikely to be drawn, PEY’s outstanding commitments were equal to 7.11x its liquid resources at 31 December 2018. If all pre-financial crisis commitments are excluded, this falls to 5.47x available resources. However, this should be viewed in the context of the timing of the fund’s drawing on its credit line and its subsequent (post-FY18 end) repayment of the borrowing. At a fully invested position with the €50m credit line undrawn, the comparable figures are 1.42x and 1.09x available resources. PEY has not historically followed an overcommitment strategy – which many private equity managers use to reduce cash drag on money that has been committed to new programmes but has not yet been invested – instead preferring to use senior loans to boost returns on uninvested cash, and co-investments to bridge gaps in the timing of direct programme investments. However, owing to the higher level of new investments than realisations during FY18, PEY’s overcommitments including the credit line stood at 11.1% of NAV at 31 December 2018.

Investments and realisations in FY18

Following on from its record year of realisations in FY17, PEY was more active in making new investments in FY18, particularly in the second half of the year (Exhibit 3). New purchases in H118 included psychometric testing specialist SHL (a €6.3m co-investment in March, alongside Exponent Private Equity Partner), US baked goods firm Hearthside Food Solutions (a €17.8m co-lead investment in May, alongside Charlesbank Capital Partners), roofing products distributor SRS Distribution (€14.1m in June), and digital dentistry firm Amann Girrbach (€8.6m, also in June). July 2018 saw €69.7m of new investments (€17.9m of which was subsequently syndicated to other investors): €19.2m in sub-metering service provider Techem, €19.2m to fund the acquisitions of industrial belt manufacturers Megadyne Group and Ammeraal Beltech, and €21.9m in product engineering and software developer GlobalLogic. In October, €19.1m of debt financing was provided to listed company Envision Healthcare in support of a private equity buyout by KKR, while November saw a €13.8m investment in Vishal Mega Mart, one of India’s largest value retail brands. In total, c €170m was invested during the year (adjusted for the subsequent partial syndication of some deals following the initial investment), including follow-on financing and the purchase of liquid senior loans for liquidity management purposes.

A steady stream of cash was returned by the legacy funds portfolio throughout the year (totalling c €55m of the c €140m realisations in FY18). Notable direct investment realisations during the year included Trimco (€19.4m received in March after the sale of the garment trimmings company to Affinity Equity Partners, with €5.7m reinvested as a co-investment), and €10.3m in July from the sale of Varsity Brands to Bain Capital. The investment in Varsity Brands generated a 3.4x multiple over the acquisition cost in December 2014, while Trimco also generated a return of 3.4x the value at acquisition in May 2012. In line with its strategy of selling down holdings in companies that have listed on a stock market, PEY received €12.4m from the sale of its remaining shares in Swiss vacuum valve manufacturer VAT Group in January 2018, and sold €5.2m worth of shares in Black Knight Financial Services between February and May. On the private debt side, proceeds of €3.6m were realised in June 2018 from a debt investment in Cooperation Pharmaceutique Française, while €3.8m of a shareholder loan to hospitality and catering firm Vermaat was repaid in December, partially de-risking the investment by returning a substantial portion of its cost.

Exhibit 3: Investments and realisations in FY18

Source: Princess Private Equity Holding, Edison Investment Research. Note: investment figures have been adjusted for post-investment syndications.

Current portfolio positioning

At 31 December 2018, PEY’s top 10 direct holdings accounted for 42.3% of the portfolio (see Exhibit 1), up from 35.7% a year earlier. Three of the top 10 holdings – private equity stakes in GlobalLogic and Hearthside Food Solutions, and a private debt investment in Envision Healthcare Holdings – were new investments in FY18.

Exhibit 4: Investments by geography and sector

Investments by geography (%)

Investments by industry sector (%)

Source: Princess Private Equity Holding, Edison Investment Research. Note: As at 31 January 2019 (geographical); 31 December 2018 (industry sector).

PEY aims to hold 50–80 direct investments (not including underlying holdings in legacy third-party funds, which had fallen to 13% of the portfolio at 31 December 2018), and primarily focuses on the mid-cap segment of the market, which made up 59% of the portfolio at 31 December 2018 (see Exhibit 1). The fund is globally diversified, taking a relative value approach to regional allocation. At end-January 2019 (Exhibit 4, left-hand chart), 51% of the portfolio was invested in Europe, a 1pp reduction from 52% at 31 January 2018. North American exposure had risen from 32% to 34%, while Asia Pacific fell from 8% to 7%, and the 8% exposure to the rest of the world was unchanged on a year earlier. The portfolio is also broadly diversified by sector (Exhibit 4, right-hand chart), although it has deliberately low exposure to cyclical industries. Compared with the MSCI AC World index, a broad global index of listed companies, PEY’s portfolio has very high exposure to consumer discretionary companies (30.0% versus 10.6% for the index), and a significantly lower weighting to financial stocks (8% versus 20.5% for the index). Sector allocations remained broadly stable over FY18, with most changes being 2pp or less in either direction.

Exhibit 5: Portfolio by sponsor type (% unless stated)

Portfolio end-December 2018

Portfolio end-December 2017

Change (pp)

Partners Group lead/co-lead

62.0

58.0

4.0

Co-investments

14.0

12.0

2.0

Funds

13.0

19.0

(6.0)

Debt

11.0

11.0

0.0

100.0

100.0

Source: Princess Private Equity Holding, Edison Investment Research

As shown in Exhibit 5, Partners Group lead or co-lead investments grew as a percentage of the portfolio during 2018, as did PEY co-investments, while the proportion in funds continued to fall as the mature legacy fund holdings returned cash.

Exhibit 6: Valuation and performance metrics for direct portfolio

Valuation metrics (as at 31 December 2018)

Performance metrics (12m to 31 December 2018)

EV/EBITDA

13.0x

Revenue growth

10.2%

Net debt/EBITDA

5.4x

EBITDA growth

11.5%

Leverage

43.2%

Weighted average revenue

€1.1bn

Weighted average EV

€2.5bn

Source: Princess Private Equity Holding, Edison Investment Research

In terms of the performance of portfolio companies (Exhibit 6), the manager points to strong revenue and EBITDA (earnings before interest, tax, depreciation and amortisation) growth of 10.2% and 11.5% respectively over 12 months to 31 December 2018, far in excess of the rate of GDP growth in any large economy. In valuation terms, EV/EBITDA (where EV is enterprise value) multiples rose from 12.2x at 31 December 2017 to 13.0x at 31 December 2018, and net debt/EBITDA rose from 4.7x to 5.4x. The leverage ratio (net debt as a percentage of enterprise value) was broadly stable, at 43.2% versus 40.6% at 31 December 2017.

Performance: Strong longer-term record

Exhibit 7: Investment company performance to 31 January 2019

Price, NAV and index total return performance, one-year rebased

Price, NAV and index total return performance (%)

Source: Refinitiv, Edison Investment Research. Note: Three, five and 10-year performance figures annualised.

Exhibit 8: Share price and NAV total return performance, relative to indices (%)


One month

Three months

Six months

One year

Three years

Five years

10 years

Price relative to LPX Europe

1.1

(3.4)

2.9

6.9

6.8

17.3

18.1

NAV relative to LPX Europe NAV

(1.1)

(3.6)

(1.4)

(1.0)

1.9

8.8

(8.7)

Price relative to MSCI World

2.4

(4.2)

(1.9)

(4.2)

10.0

19.1

50.8

NAV relative to MSCI World

(6.2)

(0.6)

3.6

5.2

3.4

6.1

(41.1)

Price relative to FTSE All-Share

2.6

(4.8)

1.7

1.2

29.3

63.1

90.5

NAV relative to FTSE All-Share

(6.0)

(1.2)

7.5

11.2

21.5

45.3

(25.6)

Source: Refinitiv, Edison Investment Research. Note: Data to end-January 2019. Geometric calculation.

Listed private equity share prices were affected by widespread stock market declines in late 2018, with both PEY and the broad LPX Europe index posting negative share price total returns for the year, before rebounding in January (Exhibit 7). However, despite portfolio valuations being marked down in line with listed equity peer valuation multiples, NAV returns held up reasonably well, with PEY producing a total return of 6.8% for the FY18 (the majority of which is accounted for by the dividend), and 7.4% for the 12 months to 31 January 2019. PEY’s share price has rebounded by over 10% so far in 2019 (to 1 March), as sentiment has recovered somewhat. Over longer periods, PEY has outperformed the index on both a share price and NAV basis, with annualised total returns of between c 11% and c 15% over three and five, compared to a range of c 11-11.5% for the LPX Europe index (price and NAV). The fund’s NAV total return has also outperformed listed equities in the UK and globally (Exhibit 8) over all periods shown except for one and three months (given the strong bounce in equities in January) and 10 years, where public markets rallied strongly from the March 2009 global financial crisis lows.

PEY’s monthly NAV return was positive in each of the first nine months of 2018 and slightly negative in October, November and December. Over the course of the year, portfolio valuation developments in aggregate contributed 10.2pp to NAV progression, while the net effect of currency movements was flat, having been positive in some months and negative in others.

Significant value drivers during FY18 included the IPO of legacy fund holding Ceridian Corporation and the sale of Varsity Brands in Q218, as well as valuation uplifts throughout the year on some of PEY’s largest holdings, including Action and Permotio International Learning. Notable value drivers in Q418 included EBITDA growth due to new customer wins for Hofmann Menue Manufaktur, and progress with the construction of two midstream gas infrastructure projects at Fermaca.

Exhibit 9: NAV total return performance relative to LPX Europe index NAV over three years

Source: Refinitiv, Edison Investment Research

Discount: Narrower than average; lower than peers

Having progressively narrowed from a five-year widest point of 27.6% in mid-2016 (following the UK’s vote to leave the European Union) to a premium of 1.0% at the end of 2017, PEY’s discount to NAV widened again during the volatile stock market conditions of 2018, reaching 24.5% on 28 December. A recovery in the share price since the beginning of 2019 has seen the discount to NAV narrow to 15.2% at 1 March. This is wider than the one- and three-year average discounts of 10.9% and 12.1%, respectively, broadly in line with the five-year average of 14.4% and substantially narrower than the 10-year average of 24.6%. PEY has tended to trade at a narrower discount than its peers, which may be partly attributable to its high distribution policy, combining the attraction of a 5–8% yield with visibility over the likely level of payouts (because the dividend for the coming year is based on a percentage of NAV at the start of the year). However, currently PEY’s discount is broadly in line with the 15.5% average for the AIC Private Equity sector, suggesting the potential for it to narrow. The manager comments that discounts on listed private equity funds look attractive for investors when viewed in the current context of secondary deals in the private equity market, where portfolios are frequently acquired at close to or above NAV.

Exhibit 10: Share price discount to NAV over three years (%)

Source: Refinitiv, Edison Investment Research

Capital structure and fees

Structured as a limited liability investment holding company, PEY is domiciled in Guernsey and listed on the Main Market of the London Stock Exchange. It has one class of share, with 69.2m ordinary shares in issue, although the shares are quoted in both euros (PEY) and sterling (PEYS). Renewed annually, the board has the authority to repurchase up to 14.99% of shares, or allot shares up to the equivalent of 10% of the issued share capital, in order to manage a discount or a premium. No shares have been issued or repurchased since 2014.

PEY has a €50m multi-currency revolving credit facility with Lloyds Bank, which may be used on a short-term basis to fund commitments. If fully drawn, the loan would equate to gross gearing of c 6.6% of NAV. Following an increased pace of investment during FY18, PEY ended the year with net gearing of 0.7%, compared with net liquidity of 11.9% of NAV at end-FY17.

Partners Group receives an annual management fee of 1.5% from PEY, paid quarterly. Incentive (performance) fees may also be paid, subject to certain conditions. If annualised returns exceed a hurdle rate of 8% pa compound, the investment manager is paid an incentive fee of up to 10% of the excess return from secondary investments, and up to 15% of the excess return on direct investments. The returns – and therefore any incentive fees payable – are calculated for each investment, rather than across the whole portfolio. For FY17 (FY18 figures are not yet available), we calculate PEY’s ongoing charges to be 1.78% excluding performance fees, and 2.59% including performance fees (FY16: 1.64% and 3.51%).

Dividend policy and record

PEY pays dividends twice a year, targeting an annual payout of c 5–8% of NAV. Because the target is set at a percentage of NAV, which may fall as well as rise, there should be no fixed expectation of year-on-year dividend growth; however, PEY’s dividend has been maintained or increased in each of the last seven financial years. For FY18, two dividends of €0.28 per share were paid in June and December; the total dividend of €0.56 represents a 5.2% payout based on the NAV per share at the start of 2018. The FY18 dividend was unchanged versus FY17, and has grown at a compound annual rate of 3.2% since the company implemented the current dividend policy in 2011. Investors may elect to have their dividends paid in sterling instead of euros, and a dividend reinvestment plan is in place for those who would prefer to use their dividends to buy further shares, rather than receiving them as income.

The majority of the dividend has historically been funded from PEY’s distributable reserves, although the portfolio’s senior debt investments also provide a source of income from which dividends could be paid. When assessing dividend cover, the manager focuses on cash flow rather than revenue and gross portfolio realisations of €140.3m were 3.6x the cost of the annual dividend. Based on the FY18 dividend and the current share price, PEY has a dividend yield of 6.0%. Given the stated distribution policy and the FY19 opening NAV of €10.90, it would be reasonable to assume dividends for the year ahead will be between €0.55 and €0.87 per share (respectively 5% and 8% of NAV).

Peer group comparison

Below in Exhibit 11, we show a selection of the larger funds in the Association of Investment Companies’ Private Equity sector, of which PEY is a member, along with the Germany-listed Deutsche Beteiligungs (DBAG), all in sterling terms. As well as being geographically diverse, the peers follow a variety of investment strategies, from wholly or largely fund of funds to wholly or largely direct, and may also include secondary investments, co-investments and private debt.

Despite having experienced the second-worst share price performance in the group over one year to 31 December, PEY’s NAV total return performance is only a little below average, and is positive in absolute terms – a stark contrast to many funds investing in listed equities during this period. It has outperformed the peer group average for NAV and share price total returns over three and five years. PEY’s discount to NAV is below the peer group median, having narrowed substantially from c 25% as the share price recovered during January and February 2019. Excluding DBAG, which trades at a premium to NAV because of the implied value of its asset management business, the peer group average discount is wider, at 16.0%. PEY’s 6.1% sterling dividend yield is the joint-highest in the group, and is substantially ahead of the 3.6% average.

Exhibit 11: Listed private equity investment companies peer group, as at 1 March 2019*

% unless stated

Country focus

Mkt cap £m

NAV TR 1 year

NAV TR 3 years

NAV TR 5 years

Price TR 1 year

Price TR 3 years

Price TR 5 years

Premium/
(discount)

Dividend yield (%)

Princess Private Equity

Global

553.6

8.0

63.4

92.7

(15.1)

55.3

98.9

(15.4)

6.1

Apax Global Alpha

Global

712.1

9.8

46.2

--

(3.5)

36.4

--

(11.3)

5.9

BMO Private Equity Trust

Global

256.6

7.6

38.8

65.2

(2.6)

48.4

90.7

(3.3)

4.1

Deutsche Beteiligungs

Europe

456.6

(0.0)

60.4

96.5

(25.7)

51.3

113.7

8.2

4.2

HarbourVest Global Priv Equity

Global

1,145.2

17.3

61.8

116.0

8.4

47.8

117.8

(17.8)

HgCapital Trust

UK

746.5

10.2

61.9

107.3

3.5

76.8

110.6

(3.2)

2.3

ICG Enterprise Trust

UK

575.6

13.2

57.3

69.4

3.0

49.7

54.9

(18.5)

2.5

JPEL Private Equity

Global

207.8

10.6

61.7

104.4

10.7

81.7

164.1

(17.4)

Oakley Capital Investments

Europe

385.0

6.4

34.7

34.7

8.8

29.0

(1.3)

(26.8)

2.4

Pantheon International

Global

1,152.1

16.9

58.5

101.5

5.8

49.8

91.6

(15.6)

0.4

Standard Life Private Eq

Europe

535.0

11.9

61.6

98.7

(2.8)

68.4

87.3

(14.2)

3.7

Symphony International Hldg

APAC

263.2

(9.4)

12.8

49.8

(14.4)

37.1

61.2

(32.5)

3.7

Peer group average

582.4

8.5

51.6

85.1

(2.0)

52.7

90.0

(14.0)

3.5

PEY rank in group (12 funds)

6

8

1

7

11

4

5

6

1

Source: Morningstar, Edison Investment Research. Note: *Performance data to 31 December 2018. TR=total return. All returns expressed in sterling terms.

The board

PEY has six non-executive directors, five of whom are considered independent of the manager. Richard Battey, who joined the board in 2009, became chairman in September 2018 following Brian Human’s retirement from the role. Henning von der Forst became a director in 2012. Felix Haldner (a partner at Partners Group, and as such deemed non-independent) and Steve Le Page (chairman of the audit committee) were appointed in 2017, with Fionnuala Carvill and Merise Wheatley joining the board in September 2018. The directors have professional backgrounds in investment management, accountancy and risk management. Fergus Dunlop resigned from the board in May 2018 and Brian Human retired as a director in November 2018.

General disclaimer and copyright

This report has been commissioned by Princess Private Equity Holding and prepared and issued by Edison, in consideration of a fee payable by Princess Private Equity Holding. Edison Investment Research standard fees are £49,500 pa for the production and broad dissemination of a detailed note (Outlook) following by regular (typically quarterly) update notes. Fees are paid upfront in cash without recourse. Edison may seek additional fees for the provision of roadshows and related IR services for the client but does not get remunerated for any investment banking services. We never take payment in stock, options or warrants for any of our services.

Accuracy of content: All information used in the publication of this report has been compiled from publicly available sources that are believed to be reliable, however we do not guarantee the accuracy or completeness of this report and have not sought for this information to be independently verified. Opinions contained in this report represent those of the Edison analyst at the time of publication. Forward-looking information or statements in this report contain information that is based on assumptions, forecasts of future results, estimates of amounts not yet determinable, and therefore involve known and unknown risks, uncertainties and other factors which may cause the actual results, performance or achievements of their subject matter to be materially different from current expectations.

Exclusion of Liability: To the fullest extent allowed by law, Edison shall not be liable for any direct, indirect or consequential losses, loss of profits, damages, costs or expenses incurred or suffered by you arising out or in connection with the access to, use of or reliance on any information contained on this note.

No personalised advice: The information that we provide should not be construed in any manner whatsoever as, personalised advice. Also, the information provided by us should not be construed by any subscriber or prospective subscriber as Edison’s solicitation to effect, or attempt to effect, any transaction in a security. The securities described in the report may not be eligible for sale in all jurisdictions or to certain categories of investors.

Investment in securities mentioned: Edison has a restrictive policy relating to personal dealing and conflicts of interest. Edison Group does not conduct any investment business and, accordingly, does not itself hold any positions in the securities mentioned in this report. However, the respective directors, officers, employees and contractors of Edison may have a position in any or related securities mentioned in this report, subject to Edison's policies on personal dealing and conflicts of interest.

Copyright: Copyright 2019 Edison Investment Research Limited (Edison). All rights reserved FTSE International Limited (“FTSE”) © FTSE 2019. “FTSE®” is a trade mark of the London Stock Exchange Group companies and is used by FTSE International Limited under license. All rights in the FTSE indices and/or FTSE ratings vest in FTSE and/or its licensors. Neither FTSE nor its licensors accept any liability for any errors or omissions in the FTSE indices and/or FTSE ratings or underlying data. No further distribution of FTSE Data is permitted without FTSE’s express written consent.

Australia

Edison Investment Research Pty Ltd (Edison AU) is the Australian subsidiary of Edison. Edison AU is a Corporate Authorised Representative (1252501) of Myonlineadvisers Pty Ltd who holds an Australian Financial Services Licence (Number: 427484). This research is issued in Australia by Edison AU and any access to it, is intended only for "wholesale clients" within the meaning of the Corporations Act 2001 of Australia. Any advice given by Edison AU is general advice only and does not take into account your personal circumstances, needs or objectives. You should, before acting on this advice, consider the appropriateness of the advice, having regard to your objectives, financial situation and needs. If our advice relates to the acquisition, or possible acquisition, of a particular financial product you should read any relevant Product Disclosure Statement or like instrument.

New Zealand

The research in this document is intended for New Zealand resident professional financial advisers or brokers (for use in their roles as financial advisers or brokers) and habitual investors who are “wholesale clients” for the purpose of the Financial Advisers Act 2008 (FAA) (as described in sections 5(c) (1)(a), (b) and (c) of the FAA). This is not a solicitation or inducement to buy, sell, subscribe, or underwrite any securities mentioned or in the topic of this document. For the purpose of the FAA, the content of this report is of a general nature, is intended as a source of general information only and is not intended to constitute a recommendation or opinion in relation to acquiring or disposing (including refraining from acquiring or disposing) of securities. The distribution of this document is not a “personalised service” and, to the extent that it contains any financial advice, is intended only as a “class service” provided by Edison within the meaning of the FAA (i.e. without taking into account the particular financial situation or goals of any person). As such, it should not be relied upon in making an investment decision.

United Kingdom

Neither this document and associated email (together, the "Communication") constitutes or form part of any offer for sale or subscription of, or solicitation of any offer to buy or subscribe for, any securities, nor shall it or any part of it form the basis of, or be relied on in connection with, any contract or commitment whatsoever. Any decision to purchase shares in the Company in the proposed placing should be made solely on the basis of the information to be contained in the admission document to be published in connection therewith.

This Communication is being distributed in the United Kingdom and is directed only at (i) persons having professional experience in matters relating to investments, i.e. investment professionals within the meaning of Article 19(5) of the Financial Services and Markets Act 2000 (Financial Promotion) Order 2005, as amended (the "FPO") (ii) high net-worth companies, unincorporated associations or other bodies within the meaning of Article 49 of the FPO and (iii) persons to whom it is otherwise lawful to distribute it. The investment or investment activity to which this document relates is available only to such persons. It is not intended that this document be distributed or passed on, directly or indirectly, to any other class of persons and in any event and under no circumstances should persons of any other description rely on or act upon the contents of this document (nor will such persons be able to purchase shares in the placing).

This Communication is being supplied to you solely for your information and may not be reproduced by, further distributed to or published in whole or in part by, any other person.

United States

The Investment Research is a publication distributed in the United States by Edison Investment Research, Inc. Edison Investment Research, Inc. is registered as an investment adviser with the Securities and Exchange Commission. Edison relies upon the "publishers' exclusion" from the definition of investment adviser under Section 202(a) (11) of the Investment Advisers Act of 1940 and corresponding state securities laws. This report is a bona fide publication of general and regular circulation offering impersonal investment-related advice, not tailored to a specific investment portfolio or the needs of current and/or prospective subscribers. As such, Edison does not offer or provide personal advice and the research provided is for informational purposes only. No mention of a particular security in this report constitutes a recommendation to buy, sell or hold that or any security, or that any particular security, portfolio of securities, transaction or investment strategy is suitable for any specific person.

Frankfurt +49 (0)69 78 8076 960

Schumannstrasse 34b

60325 Frankfurt

Germany

London +44 (0)20 3077 5700

280 High Holborn

London, WC1V 7EE

United Kingdom

New York +1 646 653 7026

1,185 Avenue of the Americas

3rd Floor, New York, NY 10036

United States of America

Sydney +61 (0)2 8249 8342

Level 4, Office 1205

95 Pitt Street, Sydney

NSW 2000, Australia

More on Princess Private Equity Holding

View All

Latest from the Investment Companies sector

View All Investment Companies content

Xbrane Biopharma — Biosimilar focus with Phase III trial about to start

Xbrane now focuses on developing high-margin biosimilar products with Xlucane, its Lucentis biosimilar, as the lead product. After the July 2018 SEK78m upfront deal with STADA, Xbrane is starting the global XPLORE Phase III trial. The primary endpoint reports in mid-2020 and XPLORE completes in February 2021. Xbrane is raising SEK59.3m at SEK30/ share to help fund its 50% share of the XPLORE study. Xbrane sold SEK20m of Spherotide (a triptorelin generic) to Iran in 2018. A partner is needed to progress development in Europe. Our valuation remains at SEK581m.

Continue Reading

Subscribe to Edison

Get access to the very latest content matched to your personal investment style.

Sign up for free