Last close As at 05/08/2026
—
— 0.00 (0.00%)
Market capitalisation
—
Research: Industrials
China Water Affairs Group Limited
Written by
China Water Affairs Group |
Tapping higher growth |
Company update |
Utilities |
10 November 2016 |
Share price performance
Business description
Next events
Analysts
China Water Affairs Group is a research client of Edison Investment Research Limited |
|||||||||||||||||||||||||||||||||||||||||||||||
We increase our valuation for China Water Affairs (CWA) to HK$6.5 per share after upgrading our earnings forecasts. We believe CWA, as the only listed equity play on Chinese tap water supply, offers investors exposure to a unique and attractive set of industry fundamentals. Strong shareholder returns driven by high-teens earnings growth are likely to continue as CWA grows capacity. Capital expenditure requirements will remain elevated as capacity growth continues. However, given CWA’s strong balance sheet and high operating cash returns, we believe it will be able to execute its growth plan without weakening its balance sheet.
Year |
Revenue (HK$m) |
PBT* |
EPS* |
DPS |
P/E |
Yield |
03/15 |
2,859 |
886 |
16.6 |
7.00 |
32.8 |
1.3 |
03/16 |
4,033 |
1,337 |
38.5 |
8.00 |
14.1 |
1.5 |
03/17e |
5,000 |
1,686 |
45.8 |
10.00 |
11.9 |
1.8 |
03/18e |
6,232 |
2,065 |
56.1 |
12.50 |
9.7 |
2.3 |
Note: *PBT and EPS are normalised, excluding amortisation of acquired intangibles, exceptional items and share-based payments.
Tap water offers superior fundamentals
Due to a combination of low private sector penetration, higher earnings quality, full asset ownership and a lower risk profile, the tap water sector provides investors with a premium offering in comparison to the wastewater sector. CWA is the only means of gaining equity exposure to this subsector in China which, we forecast, will drive its revenues by a CAGR of 21.5% in the next five years.
Numbers upgraded: Delivering growth
For FY16, CWA reported consensus-beating underlying top-line growth of 20% with City Water Supply the main driver. We now update our forecasts to reflect this as well as discussions with management. Our forecast of a 19.8% EBITDA CAGR (previously 19.2%) for FY17-21 is mainly driven by capacity, volume and tariff growth in the City Water Supply (CWS) business (81% of FY16 EBIT).
Balance sheet: No growing pains
With a net debt to EBITDA of 2.6x at end March 2016, and also taking into account the HK$9.3bn in net operating cash flow we forecast CWA will generate over the next five years, the company is in a strong position to meet its growth capex requirements. Based on our capacity growth assumptions, we estimate CWA will invest HK$10.6bn between FY17 and FY21, which will be met predominantly by internal cash flows and by increasing debt levels moderately. Net debt (Edison definition) to EBITDA will peak at 2.6x in FY17e.
Valuation: Upside despite stellar performance
Since our initiation in April, CWA’s share price has risen by 46%. We have updated our numbers and roll forward our sum-of-the-parts valuation. We increase our fair value (FV) to HK$6.5 per share from HK$4.56.
Tap water drives strong earnings and cash flow
Since our April initiation, CWA has published results (in June) well ahead of our own and consensus expectations. We take this opportunity to reassess our forecasts and valuation; we are lifting the latter by around 43% from HK$4.56 per share to HK$6.5 per share. We have updated our forecasts to reflect CWA’s outperformance in FY16 and continue to expect growth for both revenues (21.5% five-year CAGR) and EBITDA (19.8% five-year CAGR) at similar levels to our previous forecasts. Our forecasts are underpinned by strong fundamentals in the tap water industry in China together with CWA’s track record in generating high cash returns. The revenue growth in our Water Supply business forecasts in the coming years is driven by c 20% capacity growth, 5% tariff growth and 5% volume growth, while we expect the other CWS subdivision Water Supply Related Connections, to grow at 25%. This translates into a five-year revenue CAGR of 24.2% in CWS, the largest single unit at CWA. The result is a 19.5% increase in FY17e group EBITDA and a 20.5% increase in FY18e. Mechanically, this increases our fair value as our valuation is driven by an EBITDA multiple sum-of-the-arts methodology.
|
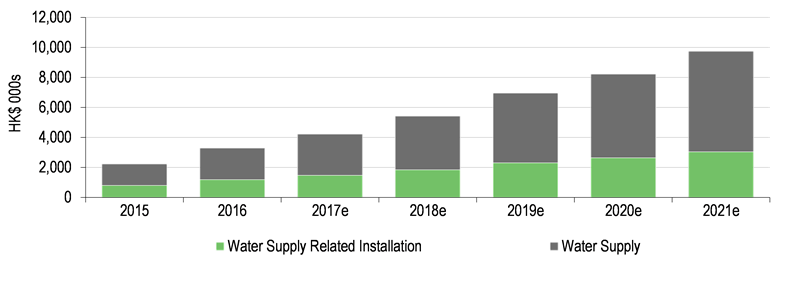
Exhibit 1: City Water Supply (CWS) revenue split |
|
|
Source: China Water Affairs, Edison Investment Research |
Tap water: Low private penetration, high cash flow potential
Around 80% of CWA’s operating profit come from its Clean Water Supply operations and Construction business. In contrast to the wastewater segment, tap water in China exhibits a low level of private market penetration, thus offering high levels of potential growth and market share expansion for market participants. CWA fully owns its assets, providing potential further embedded value in land and property assets. Growth is underpinned by high levels of urbanisation, water connection increases and Chinese GDP growth as the tap water segment is a natural monopoly whereas wastewater is not.
Of the several listed Chinese water utilities, CWA is the only one with a predominantly tap water-based business model. The rest are principally concerned with wastewater treatment. For the reasons we outline below, we believe tap water is a more attractive subsector for investors.
Full asset ownership means greater cash revenue
A key contrast between CWA’s tap water business and the wastewater sector is that private tap water operators take on full perpetual ownership of the assets. CWA’s ‘transfer own operate’ (TOO) model is shorthand for full privatisation. In contrast, wastewater operators typically operate on a concession basis, which means they return the asset to the state after a set period.
We believe asset ownership is the preferable model as it provides asset-backed, long-term cash flows, a regional monopoly status and offers investors further potential cash windfalls in the form of land sales. A further value support for CWA lies in the application of IFRIC 12 (the accounting standard concerned with concession accounting). This forces concession operators to recognise near-term revenues associated with the concession contract well before the cash from these activities arrives. Exhibit 2 shows that only 14% of CWA’s revenues relate to IFRIC 12. Consequently, CWA has far higher cash revenue ratio than its closest listed peers, which average 58% of non-cash revenues associated with this accounting standard.
|
Exhibit 2: CWA – highest ‘cash flow’ revenues in the sector |
|
|
Source: China Water Affairs, Edison Investment Research, Bloomberg |
Low private penetration means high continuing growth
CWA estimates that private sector penetration in wastewater is 90% in tier 1 cities and 80% in tier 2 cities in China. In contrast, private sector penetration in tap water as a whole is more like 15%. There is therefore a significantly higher potential of market share growth for CWA to capture, while wastewater has virtually reached its maximum level of penetration. CWA has well-established relationships with regional authorities in China. Its status as a trusted partner extends to its function as a tariff collector for other utility services on behalf of local government agencies. CWA’s relationships, reputation and existing scale ensure it is a frontrunner for new private water supply opportunities as they arise in China. Of the listed water supply companies in China, CWA has the second highest installed water supply capacity and comfortably the highest revenues from this activity.
|
Exhibit 3: Water supply capacity vs peers |
Exhibit 4: Water supply revenues vs peers |
|
|
|
Source: China Water Affairs, Beijing Enterprises, Beijing Capital |
China Water Affairs, Beijing Enterprises, Beijing Capital |
|
Exhibit 3: Water supply capacity vs peers |
|
|
Source: China Water Affairs, Beijing Enterprises, Beijing Capital |
|
Exhibit 4: Water supply revenues vs peers |
|
|
China Water Affairs, Beijing Enterprises, Beijing Capital |
Financials
CWA published its FY16 full year results in June. Key items to note were a headline revenue increase of 41% (20% once the IFRIC 12 accounting adoption is stripped out). The 20% underlying increase in full year revenues was mainly driven by high growth in the CWS segment. Installation revenues grew by 46% showing the company is continuing to connect a significant number of customers, which will, in turn, drive future revenues. We update our forecasts to reflect the stellar FY16 numbers although our revised five-year EBITDA CAGR is now slightly below our previous growth estimates (+19.8% versus +19.2%) due to the higher starting point. As demonstrated in the FY16 results, CWS is the main engine of growth. It provided 81% of group EBIT in FY16, growing by 46.9% year-on-year. Our five-year revenue CAGR of 22.8% for CWS is split between capacity growth, volume growth and tariff increases.
Financials: Upgrades across the horizon
Our updated five-year forward 21.5% revenue CAGR drives a 19.8% EBITDA CAGR over the same period. Contributing 81% of FY16 EBIT and, according to our forecasts, growing at a top-line CAGR of 24.2% for FY17-21e, the City Water Supply (CWS) unit is the main driver of CWA’s exceptional revenue expansion. High growth in CWS is, in turn, being driven by capacity growth predominantly, with positive contributions from tariff and volume increases. Capacity increases achieved by privatising formerly state-owned water supply networks will require significant capital expenditure in the years ahead. However, CWA’s strong operating cash generation and conservative balance sheet mean the company has room to invest without stretching key credit metrics; we forecast net debt to EBITDA will peak at 2.6x in FY17e.
Exhibit 5: CWA forecast change table
EPS* (c) |
PBT* (HK$m) |
EBITDA (HK$m) |
|||||||
Old |
New |
% chg. |
Old |
New |
% chg. |
Old |
New |
% chg. |
|
FY16a* |
30.42 |
38.54 |
20.2 |
1,130.5 |
1,337.4 |
15.7 |
1,613.1 |
1,820.2 |
11.6 |
FY17e |
36.10 |
45.77 |
26.8 |
1,407.0 |
1,686.2 |
19.8 |
1,907.7 |
2,279.8 |
19.5 |
FY18e |
43.78 |
56.05 |
28.0 |
1,706.0 |
2,065.3 |
21.1 |
2,290.1 |
2,759.9 |
20.5 |
Source: Edison Investment Research, China Water Affairs accounts. Note: *PBT and EPS are normalised, excluding amortisation of acquired intangibles, exceptional items and share-based payments. FY16 previous numbers were forecast versus actual.
Growth far from watered down
After a stellar FY16, CWA will seek to repeat extraordinary recent growth levels. The 41.1% revenue growth was mainly driven by a 46.9% increase in City Water Supply revenues to HK$3,296m and Sewage Treatment revenues doubled to HK$339m after a full year contribution from the Goldtrust acquisition. Within City Water Supply, Installation and Construction increased 45% year-on-year to HK$1,768m. CWA also recognised construction revenue as part of IFRIC 12 for the first time, which contributed HK$589m. Without this change in accounting policy, the year-on-year group underlying revenue increase was 20%, in line with both our previous forecasts and our growth estimates. We continue to base our earnings growth forecasts on underlying growth and do not adjust for further accounting changes in our estimates.
Unfortunately CWA does not communicate formal earnings guidance or targets. However, via a combination of speaking with management, looking at industry wide trends and taking into account its historical earnings trajectory, we forecast CWA will grow EBITDA at CAGR of 19.8% (previously 19.2%) over the next five years. The largest driver of this will come through expanding tap water supply capacity, which stood at 6.23m tonnes per day in FY16. In recent years capacity has grown by a CAGR of 9.5%, which we believe will be exceeded. Over the next five years, we forecast capacity will increase at a CAGR of 15.9%. In addition to this, tariff increases and volume increases help drive overall top-line growth in the City Water Supply business by a CAGR of 24.2% to FY21e. This converts to a group top-line CAGR 21.5% over the next five years.
Our EBITDA margin forecast over this period declines from 45.1% in FY16 to 42.5% in FY20 as a function of a smaller percentage of revenues coming from higher-margin ‘connection fees’ associated with meter installations for new tap water customers (see Exhibit 1 for an explicit CWS divisional revenue forecast split). CWA has two revenue components: ‘Water Supply’ and ‘Connection Fees’. Water Supply related installation reflects setting up new customers on its tap water supply network, including meter installation. CWA charges a one-off amount for this, which we estimate is highly profitable. Water Supply reflects revenue received from each customer for supplying tap water. We believe this to be at a lower operating margin than from its installation business. Installation fees are likely to be a diminishing percentage of overall revenues and so therefore we expect margins to decline over our forecast period.
Capex requirements met by operating cash with balance sheet capacity
The corollary of our forecast for rapid tap water capacity expansion is an upward-sloping capex trajectory. We forecast tap water supply capex will increase markedly to FY19 as the company aims to install significantly more capacity, and thereafter it will drop off. It is noteworthy that once capacity has been added, maintenance capex is very small (below HK$100m).
|
Exhibit 6: Tap water supply capex rising (Edison forecasts) |
|
|
Source: China Water Affairs, Edison Investment Research |
Net operating free cash flow will return HK$8.6bn over the next five years according to our forecasts, covering the majority of our forecast capital investment of HK$10.6bn in the same period. The fact that the balance sheet is conservatively geared for a regulated utility (FY16 2.6x net debt to EBITDA – Edison definition) means that there is more capacity to finance growth. We see net debt to EBITDA peaking at 2.6x in FY17e and net debt to equity peaking in FY19e at 74%.
Our balance sheet forecasts assume CWA continues to grow its dividend in line with growth in retained earnings. We expect CWA to more than double its dividend by FY21. FY16’s dividend was 8.0c/share, which we estimate will increase to 20.0c/share in FY21. Based on our five-year CAGR of 18.2% in net income, this dividend growth can be achieved without increasing the payout ratio above 25%. The FY16 report stated that CWA had repurchased a total of 16.32m shares for a total consideration of HK$63.7m. We await further news from management about the composition of shareholder returns, but we reiterate our view from previous publications that shareholder returns can be higher without weakening the balance sheet. The FY16 and FY17e yields of 1.5% and 1.8% are low in comparison to other regulated names.
High profitability and low leverage make enhanced returns more likely
In the context of regulated utilities, CWA is conservatively geared. At 2.6x FY16 net debt (Edison definition) to EBITDA and 61.7% FY16 net debt (Edison definition) to equity, the company has further room to expand its balance sheet. Edison’s definition of net debt is stricter than CWA’s as we do not include pledged deposits as a cash equivalent. We forecast CWA’s gearing will increase from 61.7% to 74.0% to FY19, and then decline as investment tails off. Despite this, (Edison) net debt to EBITDA peaks at only 2.6x in FY17e and interest is well covered (profit from operation/ finance costs) at around 10x across our forecast period.
|
Exhibit 7: CWA capex peak and associated EBITDA |
|
|
Source: Edison Investment Research. Note: Capex at operating segment level does not include associates, acquisition of subsidiaries. |
Valuation
The principal valuation methodology used in arriving at our updated FV of HK$6.5 per share is a segmental sum-of-the-parts (SOTP). Our FV increase from HK$4.56 reflects the ‘rolling forward’ of the SOTP to FY18e, as well as a c 20% increase in FY17e and FY18e EBITDA.
Exhibit 8: CWA sum-of-the-parts valuation
Current price (HK$) |
5.44 |
|
|
|
Fair value per share (HK$) |
6.5 |
|
||
Upside/(downside) to FV |
16.3% |
|
||
Dividend yield (FY16a) |
2.3% |
|
||
Total return |
20.1% |
|
||
Current number of shares (m) |
1,520 |
|
||
Segment |
Valuation method |
HK$000s |
Multiple |
Total (HK$000s) |
City Water Supply Operation and Construction |
FY18e EBITDA multiple |
2,447 |
6.5 |
15,905 |
Sewage Treatment Operation and Construction |
FY18e EBITDA multiple |
179 |
6.0 |
1,076 |
Property Development and Investment |
FY16a Book Value Multiple |
1,646 |
2.0 |
3,293 |
Concrete Related Products and Services |
FY18e EBITDA multiple |
68 |
5.0 |
338 |
All other segments |
FY18e EBITDA multiple |
31 |
5.0 |
155 |
Group enterprise value |
|
|
20,767 |
|
Less: FY18e net debt |
|
|
6,970 |
|
Less: FY18e Pensions and other |
|
|
0 |
|
Less: FY18e Minorities |
|
|
3,895 |
|
SOTP valuation |
|
|
|
9,902 |
Source: China Water Affairs, Edison Investment Research
Given the rapid growth we forecast, especially in the City Water Supply business (+26% year-on-year), our FV increases substantially. We have not altered our segment EBITDA multiples, which is conservative given the excellent growth being delivered by management and taking into account inflated multiples for regulated assets globally. However, as private sector involvement in tap water supply is at a nascent stage, we believe it is better to be prudent on EBITDA multiples at this stage.
Exhibit 9: Peer comparison
Company |
Share price (local) |
No of shares (m) |
Market cap (local m) |
Dividend |
Current |
Next P/E |
Current EV/ |
Next EV/ EBITDA |
FCF yield |
Next net debt*/ EBITDA (x) |
China Water Affairs |
5.53 |
1520 |
8,814 |
1.8 |
12.1 |
12.1 |
5.7 |
5.4 |
7.1 |
2.6 |
Guangdong Investment |
12.02 |
6264.9 |
75,304 |
2.8 |
16.9 |
15.4 |
9.5 |
8.8 |
4.8 |
-1.1 |
Beijing Enterprises Water Group |
5.98 |
8730.8 |
52,210 |
1.6 |
17.1 |
13.9 |
14.1 |
11.6 |
-12.2 |
4.5 |
Tianjin Capital Environmental Protection Group Co |
4.45 |
340.0 |
1,513 |
1.6 |
15.1 |
14.4 |
2.9 |
2.8 |
23.2 |
1.3 |
Average Hong Kong Listed |
|
2.0 |
16.4x |
14.6 |
8.8 |
7.7 |
5.3 |
1.6 |
||
Beijing Originwater Technology Co |
17.80 |
3123.4 |
55,597 |
0.2 |
26.6 |
16.9 |
20.3 |
13.9 |
-3.3 |
-1.7 |
Chongqing Water Group Co |
7.85 |
4800.0 |
37,680 |
3.3 |
25.3 |
25.7 |
15.2 |
15.8 |
3.8 |
-1.1 |
Tus-Sound Environmental Resources Co |
34.20 |
854.3 |
29,217 |
0.4 |
25.8 |
20.8 |
17.1 |
13.2 |
-3.9 |
2.4 |
Average Mainland China Listed |
|
1.3 |
25.9 |
21.1 |
17.6 |
14.3 |
-1.1 |
-0.1 |
||
Veolia Environnement |
17.52 |
563.4 |
9,867 |
4.2 |
17.5 |
14.5 |
5.7 |
5.4 |
5.7 |
2.5 |
Suez |
13.49 |
564.4 |
7,611 |
4.8 |
17.7 |
15.3 |
5.9 |
5.6 |
4.4 |
3.0 |
Severn Trent |
2,248.00 |
235.7 |
5,298 |
3.6 |
21.5 |
21.0 |
12.0 |
11.5 |
2.8 |
5.7 |
United Utilities Group |
919.00 |
681.9 |
6,267 |
4.2 |
20.1 |
19.6 |
13.2 |
12.6 |
0.9 |
6.9 |
Average Europe |
|
|
|
4.2 |
19.2 |
17.6 |
9.2 |
8.8 |
3.5 |
4.5 |
Average global |
|
|
|
2.7 |
20.4 |
17.7 |
11.6 |
10.1 |
2.6 |
2.2 |
Source: China Water Affairs, Edison Investment Research, Bloomberg. Note: *Edison definition, which excludes pledged deposits. Prices as at 8 November 2016.
Exhibit 9 shows CWA trades at a discount to its closest peers listed in both Hong Kong and mainland China. It trades at a c 23% discount to prospective EV/EBITDA of Hong Kong-listed water utilities and over a 40% discount to the global average. This comes despite the extraordinarily high growth profile and earnings characteristics we described earlier in the note. On P/E too it trades at a discount to all other listed peers. Crucially, from a cash-generation perspective, CWA exceeds almost all of its closest listed peers. With an operating free cash flow per share of HK$0.99, equivalent to a 16.6% free cash flow yield, it returns more than six times as much cash profit as its closest peers.
Exhibit 10: Financial summary
HK$m |
2014 |
2015 |
2016 |
2017e |
2018e |
||
31-March |
IFRS |
IFRS |
IFRS |
IFRS |
IFRS |
||
PROFIT & LOSS |
|||||||
Revenue |
|
|
2,747 |
2,859 |
4,033 |
5,000 |
6,232 |
Cost of Sales |
(1,599) |
(1,506) |
(2,132) |
(2,592) |
(3,266) |
||
Gross Profit |
1,147 |
1,352 |
1,901 |
2,408 |
2,966 |
||
EBITDA |
|
|
1,075.8 |
1,299.8 |
1,820.2 |
2,279.8 |
2,759.9 |
Operating Profit (before amort. and except.) |
771 |
1,001 |
1,479 |
1,848 |
2,269 |
||
Intangible Amortisation |
0 |
0 |
0 |
0 |
0 |
||
Exceptionals |
58 |
136 |
(30) |
0 |
0 |
||
Other |
0 |
0 |
0 |
0 |
0 |
||
Operating Profit |
829 |
1,137 |
1,449 |
1,848 |
2,269 |
||
Net Interest |
(107) |
(117) |
(171) |
(162) |
(203) |
||
Profit Before Tax (norm) |
|
|
730 |
886 |
1,337.4 |
1,686.2 |
2,065.3 |
Profit Before Tax (FRS 3) |
|
|
788 |
1,021 |
1,308 |
1,686 |
2,065 |
Tax |
(230) |
(317) |
(305) |
(422) |
(516) |
||
Profit After Tax (norm) |
500 |
569 |
1,033 |
1,265 |
1,549 |
||
Profit After Tax (FRS 3) |
558 |
704 |
1,003 |
1,265 |
1,549 |
||
Average Number of Shares Outstanding (m) |
1,423.2 |
1,416.9 |
1,508.5 |
1,519.9 |
1,519.9 |
||
EPS - normalised (c) |
|
|
15.7 |
16.6 |
38.5 |
45.8 |
56.1 |
EPS - normalised and fully diluted (c) |
|
15.7 |
16.6 |
38.54 |
45.77 |
56.05 |
|
EPS - (IFRS) (c) |
|
|
19.8 |
26.2 |
36.6 |
45.8 |
56.1 |
Dividend per share (c) |
5.0 |
7.0 |
8.0 |
10.0 |
12.5 |
||
Gross Margin (%) |
41.8 |
47.3 |
47.1 |
48.2 |
47.6 |
||
EBITDA Margin (%) |
39.2 |
45.5 |
45.1 |
45.6 |
44.3 |
||
Operating Margin (before GW and except.) (%) |
28.1 |
35.0 |
36.7 |
37.0 |
36.4 |
||
BALANCE SHEET |
|||||||
Fixed Assets |
|
|
8,578 |
9,416 |
11,313 |
12,783 |
14,556 |
Intangible Assets |
424 |
415 |
1,428 |
1,428 |
1,428 |
||
Tangible Assets |
5,425 |
5,995 |
6,716 |
8,186 |
9,959 |
||
Investments |
1,827 |
2,106 |
2,242 |
2,242 |
2,242 |
||
Other |
902 |
901 |
928 |
928 |
928 |
||
Current Assets |
|
|
4,929 |
5,686 |
7,507 |
8,079 |
8,894 |
Stocks |
249 |
301 |
289 |
358 |
446 |
||
Debtors |
578 |
656 |
1,084 |
1,343 |
1,674 |
||
Cash |
1,590 |
1,501 |
2,552 |
2,563 |
2,662 |
||
Other |
2,513 |
3,228 |
3,583 |
3,815 |
4,112 |
||
Current Liabilities |
|
|
(3,972) |
(5,214) |
(5,557) |
(5,430) |
(5,632) |
Creditors |
(529) |
(486) |
(855) |
(728) |
(931) |
||
Short term borrowings |
(1,299) |
(2,376) |
(2,156) |
(2,156) |
(2,156) |
||
Other |
(2,143) |
(2,352) |
(2,546) |
(2,546) |
(2,546) |
||
Long Term Liabilities |
|
|
(3,839) |
(3,452) |
(5,715) |
(6,915) |
(8,115) |
Long term borrowings |
(3,524) |
(3,024) |
(5,076) |
(6,276) |
(7,476) |
||
Other long term liabilities |
(316) |
(428) |
(639) |
(639) |
(639) |
||
Net Assets |
|
|
5,696 |
6,436 |
7,548 |
8,517 |
9,703 |
CASH FLOW |
|||||||
Operating Cash Flow |
|
|
554 |
566 |
1,494 |
1,591 |
2,246 |
Net Interest |
(34) |
(0) |
(72) |
(162) |
(203) |
||
Tax |
(106) |
(201) |
(160) |
(422) |
(516) |
||
Capex |
(794) |
(781) |
(670) |
(1,901) |
(2,265) |
||
Acquisitions/disposals |
0 |
0 |
(972) |
0 |
0 |
||
Financing |
(343) |
(134) |
(82) |
0 |
0 |
||
Dividends |
(71) |
(85) |
(106) |
(136) |
(167) |
||
Net Cash Flow |
(792) |
(635) |
(569) |
(1,030) |
(906) |
||
Opening net debt/(cash) |
|
|
2,234 |
3,377 |
3,966 |
4,649 |
5,679 |
HP finance leases initiated |
0 |
0 |
0 |
0 |
0 |
||
Other |
(351) |
46 |
(114) |
0 |
0 |
||
Closing net debt/(cash) |
|
|
3,377 |
3,966 |
4,649 |
5,679 |
6,584 |
Source: China Water Affairs accounts, Edison Investment Research
|
|
Scottish Oriental Smaller Companies Trust