Currency in -
Last close As at 09/06/2023
-1,240.00
— 0.00 (0.00%)
Market capitalisation
GBP326m
Research: Investment Companies
Fundsmith Emerging Equities Trust (FEET), an emerging markets (EM) consumer theme focused investment trust launched in 2014, has recently undergone a gradual, but notable transition. In May 2019 Michael O’Brien and Sandip Patodia took over day-to-day management from Terry Smith, to focus full-time on FEET. The trust, which has evolved with the emerging consumer story since launch, has retained the same strategy: to own high-quality, consumer-focused companies. A number of changes of emphasis have been made. The managers have made the portfolio more focused by number of holdings (38 at end-December 2020) yet have diversified it by theme and sector. The managers stress that the fund suits patient investors with a long-term time horizon, as the underlying strong portfolio fundamentals should eventually come through in superior performance, regardless of market momentum.
Fundsmith Emerging Equities Trust |
Sticking to its guns |
Investment trusts |
29 January 2021 |
Initiation of coverage |
Share price/discount performance Three-year performance vs index
Gearing
Analysts
|
Fundsmith Emerging Equities Trust (FEET), an emerging markets (EM) consumer theme focused investment trust launched in 2014, has recently undergone a gradual, but notable transition. In May 2019 Michael O’Brien and Sandip Patodia took over day-to-day management from Terry Smith, to focus full-time on FEET. The trust, which has evolved with the emerging consumer story since launch, has retained the same strategy: to own high-quality, consumer-focused companies. A number of changes of emphasis have been made. The managers have made the portfolio more focused by number of holdings (38 at end-December 2020) yet have diversified it by theme and sector. The managers stress that the fund suits patient investors with a long-term time horizon, as the underlying strong portfolio fundamentals should eventually come through in superior performance, regardless of market momentum.
Progress on portfolio themes in 2019 and 2020 |
Source: Fundsmith, Edison Investment Research |
Consumer proposition expanded
The chart above illustrates FEET’s sector emphasis shifting away from frontier markets and consumer staples towards consumer-driven healthcare, technology and family-controlled businesses, operating predominantly in EM.
Opportunities |
Risks |
■ Differentiated return potential from highly concentrated (target 35–40 stocks) portfolio, EM indices agnostic, geographically and by sector. |
■ Investors may shun active EM funds, and continue buying trackers or allocate money elsewhere. |
■ A long-term portfolio of companies with superior margins, consistent cash conversion and faster cash flow growth relative to the benchmark. The team strives to buy the best businesses and ideally, hold them for decades, so the geographic split of the portfolio is an outcome of their proprietary investment process. |
■ The fund is still very highly geographically concentrated in India and in China to a lesser extent, but this should balance out over time with other geographies, as the portfolio and the investible universe are refreshed by managers. |
■ Restructured portfolio and process have resulted in improved absolute and relative performance. |
■ If a wider than 10% discount persists, a continuation vote resolution might be proposed by the board during FY21. |
Discount: Has nearly disappeared
The trust currently trades very close to premium to its cum-income NAV on a 3.9% discount, above its three-year average of 5.3% and one-year average of 11.6%. The team’s consistent implementation of its strategy regardless of shorter-term market fluctuations and a gradual portfolio transition have resulted in the discount narrowing. The board monitors the share price discount and has been primarily addressing it via investor education activities rather than active share buybacks.
Exhibit 1: Trust at a glance
Investment objective and fund background |
Recent developments |
|||||||||||||||||||||||||||||||||||||||||||||||||||||||||||||||||||||||||||||||||||||||||||
Fundsmith Emerging Equities Trust’s (FEET) investment objective is to provide shareholders with an attractive return by investing in a portfolio of listed companies that operate in or sell into developing economies, providing exposure to the growing proportion of middle-class consumers in these countries. |
■ 4 August 2020: H120 results released. ■ May 2019: Michael O’Brien and Sandip Patodia were appointed portfolio manager and assistant portfolio manager, respectively. |
|||||||||||||||||||||||||||||||||||||||||||||||||||||||||||||||||||||||||||||||||||||||||||
Forthcoming |
Capital structure |
Fund details |
||||||||||||||||||||||||||||||||||||||||||||||||||||||||||||||||||||||||||||||||||||||||||
AGM |
May 2021 |
Ongoing charges |
1.4% (FY19) |
Group |
Fundsmith LLP |
|||||||||||||||||||||||||||||||||||||||||||||||||||||||||||||||||||||||||||||||||||||||
Annual results |
February-March 2021 |
Net gearing |
None |
Manager |
Michael O’Brien |
|||||||||||||||||||||||||||||||||||||||||||||||||||||||||||||||||||||||||||||||||||||||
Year end |
31 December |
Annual mgmt fee |
1.0% |
Address |
33 Cavendish Square, London, W1G 0PW |
|||||||||||||||||||||||||||||||||||||||||||||||||||||||||||||||||||||||||||||||||||||||
Dividend paid |
June (at the board’s discretion) |
Performance fee |
None |
|||||||||||||||||||||||||||||||||||||||||||||||||||||||||||||||||||||||||||||||||||||||||
Launch date |
June 2014 |
Trust life |
Indefinite |
Phone |
+44 (0)20 3551 6337 |
|||||||||||||||||||||||||||||||||||||||||||||||||||||||||||||||||||||||||||||||||||||||
Continuation vote |
Annual, at the board’s discretion, conditional on a >10% average discount over a financial year |
Loan facilities |
None |
Website |
||||||||||||||||||||||||||||||||||||||||||||||||||||||||||||||||||||||||||||||||||||||||
Dividend policy and history (financial years) |
Share buyback policy and history (financial years) |
|||||||||||||||||||||||||||||||||||||||||||||||||||||||||||||||||||||||||||||||||||||||||||
The first final dividend was introduced in FY18. Dividends are payable in June and remain at the board’s discretion (as required to maintain UK investment trust status). |
Renewed annually, the trust has authority to purchase up to 14.99% and allot up to 10% of issued share capital. |
|||||||||||||||||||||||||||||||||||||||||||||||||||||||||||||||||||||||||||||||||||||||||||
Shareholder base (as at 31 December 2020) |
Portfolio exposure by GICS sector (as at 31 December 2020) cash weighted |
|||||||||||||||||||||||||||||||||||||||||||||||||||||||||||||||||||||||||||||||||||||||||||
Top 10 holdings (as at 31 December 2020) |
||||||||||||||||||||||||||||||||||||||||||||||||||||||||||||||||||||||||||||||||||||||||||||
|
Source: Fundsmith Emerging Equities, Edison Investment Research, Bloomberg, MSCI
Fund profile: Gradual transition during 2019 and 2020
FEET’s investment objective is to provide shareholders with an attractive return by investing in a portfolio of shares issued by listed or traded companies that have a majority of their operations in, or revenue derived from, developing economies and that provide direct exposure to the rise of the consumer classes in those countries. The managers buy into cash-generative businesses with sustainable cash flows and highly resilient business models. These businesses reinvest generated cash flows at attractive rates of return. The team strives to buy the best businesses and ideally hold them for decades.
The portfolio manager, Michael O’Brien, and assistant portfolio manager, Sandip Patodia, who took over FEET’s day-to-day management from Fundsmith founder, Terry Smith in May 2019, apply the house global equity strategy to the EM investment universe. We believe, this handover is a positive development, as the two managers can focus all their attention on FEET, while Smith has other responsibilities as CEO and CIO of Fundsmith.
As the trust has matured over time, the team has gained insights into where the Fundsmith approach needed to be adjusted to invest more effectively in EM. During 2019, the managers made amendments to the portfolio and the process. Firstly, the development of capital markets since the fund launch has allowed the team to include more stocks in the investible universe (IU) and to include a larger number of sectors, emphasising technology and healthcare. Secondly, they reduced exposure to frontier markets, where sharp currency movements had materially and negatively affected total returns. Finally, the team shifted portfolio weightings more towards locally focused businesses and away from multinational subsidiaries that, in their view, lack the agility of their local rivals.
FEET has a very high active share (93.7% at 31 December 2020). The managers do not track a specific benchmark as the majority of the major index constituents do not match their investment criteria. The fund is still very highly geographically concentrated in India and, to a lesser extent, in China, where the fund is materially underweight relative to the benchmark. These geographic tilts may balance out across the EM universe as the portfolio and the investible universe are refreshed by managers. The present bias towards India and relative weight towards China is an outcome based around the quality of companies the team invest in, which is driven by the investment process.
The fund manager: Fundsmith
The team
Fundsmith currently manages over £33bn (as at 31 December 2020) in global growth equity strategies based on the same investment philosophy, across three funds and four segregated accounts in different jurisdictions. FEET’s team of five has worked on the trust since its launch in June 2014 and includes Terry Smith, the CEO, CIO and founder of Fundsmith. Michael O’Brien is the portfolio manager responsible for investment decisions, and Sandip Patodia is the assistant portfolio manager. Jonathan Imlah and Tom Boles are analysts. The team do their own research in-house and do not use broker research. Each of the four core team members has responsibility for a defined geographical area. Smith ran FEET from launch until May 2019, when he handed over daily running of the fund to O’Brien and Patodia. Since then, Smith has remained involved in management of the fund, continues to meet with the board, and provides advice and support for the team, who consult him in his role as CIO on all new outright stock purchases and sales.
The managers’ view: Investing in cash-generative businesses
The managers believe that an investor gets rewarded by buying cash-generative businesses with sustainable cash flows. FEET’s team buys companies that have the ability to reinvest their cash flows in supporting growth at high incremental returns. These businesses’ repetitive and sustainable everyday transactions are the best warranty for them to generate growth and high shareholder returns over the long term. Although their P/E ratios may exceed those of the benchmark, their cash flow generation ability and return on capital employed (ROCE) are superior. The focused approach centres around buying good companies, not overpaying for them and with an ideal holding period of forever.
The portfolio holdings reflect the bottom-up stock selection process, described in the Investment process section below. The team has a vision to buy into companies that will be offering the best products and services for decades to come, whether they are located in India, China or any other emerging or frontier market. Consideration is given to the macroeconomic and regulatory environment of the markets in which a business operates. An investment is only made after a macroeconomic country risk assessment of a company’s business.
The largest EM countries, namely China (including Hong Kong) and India, are significantly represented in both FEET’s investible universe (IU) and its portfolio. Combined, they comprise around 59% (at 31 December 2020) of FEET’s holdings, and are likely to continue to form the biggest (or a very large) part of the portfolio going forward.
The trust’s Indian consumer-focused companies have superior fundamental characteristics in terms of profitability, growth and cash generation relative to other sectors. The managers believe that India has a large number of some of the best global companies to fit the fund’s remit. Investors are ‘spoilt for choice’, with many multinational subsidiaries listed in India, alongside national and regional businesses. The difficult operating environment, such as hard-to-set-up distribution and logistics channels, gives established Indian businesses the advantage of high barriers to entry. These characteristics mean Indian companies fit well within FEET’s mandate.
To date, FEET’s team has found only a handful of Chinese companies to fit their investment criteria and be suitable for investment. Factors such as opacity, governance, accounting policies, regulation and capital allocation, in the team’s view, applicable to many Chinese listed businesses, are the key determinant for the team to shy away from including them in FEET’s investible universe.
The managers are also concerned about speculation in Chinese stocks. According to the managers, the Chinese government has encouraged equity bull markets after periods of economic weakness before. The FEET team cites current state-sponsored journals in the mainland that call for the ‘fostering of a healthy bull market’, helped by the direction of cash from state funds, corporate-backed wealth management products (which are typically opaque) and private investors.
The team has typically shied away from investing in Taiwan and South Korea as they consider these two countries developed markets in terms of GDP and demographics; however, they made their first investment in a Taiwanese company in Q420.
Market outlook: Undervalued emerging markets
EM equities have lagged world equities for some time, and, as a consequence, trade at lower valuations. Exhibit 2 illustrates that emerging and frontier markets combined underperformed global equities by c 125% over the past 10 years. Exhibit 3 showcases that EM equities on 16.0x forward P/E remain discounted relative to developed markets (20.0x). Over 10 years the average forward P/E (at December 2020, source: Refinitiv) of 12.0x for EM compares to 14.5x for developed markets.
Exhibits 2 and 3: Market performance and valuation |
|
Exhibit 2: Performance (rebased) |
Exhibit 3:Valuation metrics* |
Source: Refinitiv, Edison Investment Research at end-December 2020. Note: *Datastream indices used. |
More recently, EM equities rallied for five consecutive months, starting in April, pausing in September. The EM equity market is climbing rapidly to exceed pre-COVID-19 heights, albeit not as rapidly as US-dominated global indices.
The EM recovery, however, has been uneven, with performance diverging markedly between the countries. In the year to the end of Q320, most EM countries posted negative returns, with the MSCI Emerging & Frontier Markets Index returning -3.6%. North Asia (China, Korea, Taiwan) outperformed within the EM. Then in Q4 the markets rallied strongly, following the news about pharma companies’ readiness to offer effective COVID-19 treatment vaccines. During 2020 South Korea performed the strongest, +35.8%, followed by Taiwan +25.2% and China and Hong Kong combined, with +19.5% (in GBP). Of all the companies represented in the index, China’s well-known internet giants within the consumer discretionary and communications services sectors performed most strongly, driving the outperformance of these two sectors. Three stocks – Alibaba, Meituan and Tencent – were responsible for nearly 90% of China’s 2020 outperformance. These companies alone represented roughly one-third of the MSCI Emerging & Frontier Markets’ outsized gains in the third quarter.
Healthcare, information technology and consumer staples were the three outperforming sectors in 2020. During Q420 the performance of some well-known Chinese technology companies, in particular Alibaba, weakened, principally due to two reasons. First, the Chinese government tightened its grip over large private technology businesses and the blockage of Ant’s IPO in December 2020 dented a few technology companies’ share prices. Second, US stock exchanges have increased scrutiny over US-listed Chinese businesses and have flagged messages about their potential US delisting.
We agree with FEET’s managers that the COVID-19 pandemic is likely to accelerate three trends – consolidation, formalisation and digitalisation – as discussed within the portfolio’s context in the portfolio positioning section below.
Asset allocation
Investment process: Buy good, don’t overpay, do ‘nothing’
The three building blocks of the strategy are:
1. Buy good companies: the team selects good companies with the following four characteristics:
•
Quality: high cash returns on operating capital employed;
•
Growth: driven from reinvestment of their cash flows at high rates of return;
•
Predictability: making money from a large number of everyday, small-ticket, repeat, predictable transactions; and
•
Sustainability: able to protect returns against competition.
2. Do not overpay: in terms of valuation, the team looks at the cash flow yield of a company and assesses it in the context of sustainability of the company’s competitive advantage and longevity of growth prospects. Competitive advantages could be represented by brand, market structure, distribution, logistics, regulation or scale.
3. Do nothing: FEET’s ideal holding period is ‘forever’.
The trust’s investment approach adds one extra dimension to the group’s global growth equity strategy: the companies invested in by FEET have the majority of their operations in, or revenue derived from, developing economies, providing direct exposure to the rise of the consumer classes in those countries.
Prior to the fund’s launch in 2014 the team identified about 120 companies with profiles fitting into their investment strategy. These formed the initial IU for FEET, which the team has refined to the currently maintained and regularly refreshed monitoring list of around 80 quoted businesses (the fund only invests in quoted businesses on recognised exchanges). The primary criterion for a company to remain in the universe is whether it continues to fit the remit of being a good company according to the fund managers’ investment process.
Since the handover of the fund to O’Brien and Patodia, the team has identified a growing range of investible listed opportunities that fit their criteria to broaden the portfolio beyond the direct consumer sector, but are driven by consumer themes. They have incorporated more companies from sectors outside direct consumer (staples and discretionary), particularly technology and healthcare. Backed by the house’s investment process, the managers avoid the financial sector and heavily cyclical areas such as construction and manufacturing, utilities, resources and transport, instead focusing on consumer-exposed businesses. The team may occasionally invest in IPOs.
O’Brien builds a concentrated portfolio of 35–40 holdings, with all the names coming from the IU. FEET’s mandate allows the managers to have 35–55 portfolio holdings and their target is to remain closer to the lower end of this range. As at end December 2020 the portfolio comprised 38 holdings.
Another evolution in the approach since O’Brien and Patodia took over has been the greater attention to the macroeconomic environment. The team assesses all countries eligible for the remit to evaluate their macro risks, in particular the currency risk. They also pay attention to these countries’ economic, political, social and business backdrop.
The active share has been consistently above 90%. The manager is index agnostic and buys good businesses regardless of index inclusion, believing every investee company should be a sound business on a standalone basis.
Exhibit 4 below illustrates that currently the portfolio companies’ characteristics are superior to those of the majority of MSCI EM & Frontier Markets index stocks. While FEET’s implied portfolio P/E of 37.2x is c 1.6x that of the index (22.8x), ROCE of 40% is nearly 4x that of the index. Other quality and growth ratios (gross and operating margins, free cash flow growth) also compare favourably with those of the index. If we use Fundsmith’s global portfolio (available to retail investors as the open-ended Fundsmith Equity Fund) as a proxy for global stocks, Exhibit 4 also highlights exposure to faster-growing and higher cash flow generative businesses than the global market or EM indices currently provide. FEET’s portfolio companies generate higher profits and cash flows compared to both the EM index and Fundsmith’s global portfolio.
Exhibit 4: Selected FEET portfolio metrics relative to the index and FEF
FEET |
MSCI EM & Frontier Markets Index |
Fundsmith Equity Fund (FEF) |
|
Quality |
|||
ROCE |
40% |
11% |
25% |
Gross margin |
52% |
33% |
65% |
Operating margin |
18% |
11% |
23% |
Cash conversion |
93% |
82% |
101% |
Growth |
|||
Free cash flow growth |
21% |
8% |
8% |
Valuation |
|||
Implied P/E |
37.2x |
22.8x |
36.1x |
Free cash flow yield |
2.5% |
3.6% |
2.8% |
Portfolio dividend yield |
1.4% |
1.8% |
1.4% |
Source: Fundsmith, Edison Investment Research as at 31 December 2020.
Post the 2019 restructuring and in a steady state, the average annual portfolio turnover is likely to be fairly low. Turnover averaged c 30% between FY16 and FY20.
Corporate engagement is an integral part of the process. Before the COVID-19 pandemic, O’Brien travelled five or six weeks a year to meet companies on the ground. This year engagement with companies has shifted to online meetings and calls, with the team considering that access to companies has been excellent. About a third of the companies in which FEET may invest are quoted subsidiaries or franchisees of the multinational companies that may be held in Fundsmith Equity Fund. This helps the team to conduct due diligence and assess the corporate governance of these subsidiaries.
Governance and reporting standards are areas of careful consideration within the team’s investment process. Due diligence in corporate governance includes analysing board structure and control, whether there are differential voting rights, the ownership structure of the subsidiaries, minority rights protections, management incentivisation and the track record of managements. For example, one of the reasons the fund is less represented in China than peers is that a number of Chinese businesses fall down in the area of governance.
While Fundsmith does not dogmatically follow environmental, social and governance (ESG) approaches, the portfolios have favourable ESG characteristics, as they are composed of businesses with very strong ESG credentials. Firstly, the investment process leads the team away from investing in asset intensive businesses, which often have pollution issues (ie cement, oil and gas). Secondly, a brand element in most of FEET’s portfolio companies further strengthens their ESG credentials due to these companies’ own corporate efforts towards improving their ESG status.
FEET’s investment policy assumes the following limits of investments to gross assets:
■
5% (or 10% of up to 40% of gross assets) in a single company;
■
40% in any single country (at the time of investment);
■
20% can be in deposits held with a single bank or financial institution; and
■
20% can consist of shares and approved money market instruments or holdings in any combination of shares or deposits, issued by the same group.
The managers do not typically hedge their currency exposure.
The team believes that the closed-end structure fits well with the long-term nature of the fund. FEET’s portfolio companies are relatively illiquid and the closed-end fund structure allows the managers to maintain their conviction holding positions at times of depressed share prices, such as during the current pandemic, without being forced to sell them at a loss to fund redemptions.
Current portfolio positioning
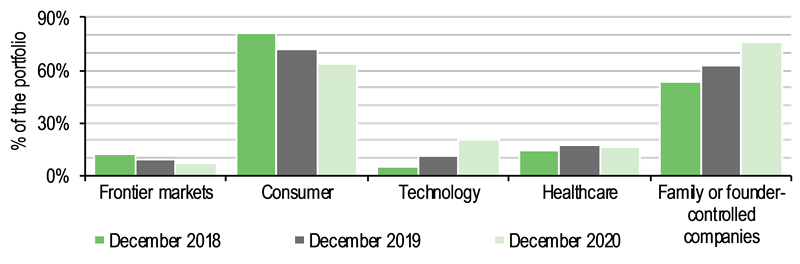
The portfolio had 38 holdings at 31 December 2020. The manager has adjusted the fund’s positioning over the past two years, making the portfolio more focused by number of holdings and more diversified by theme and sector. The number of holdings was reduced from 45 at December 2018. Exhibits 5 and 6 illustrate the transition of the portfolio by theme and sector. While frontier markets and consumer exposures have been reduced, technology, healthcare and family/founder-controlled businesses in all portfolio countries have increased.
Exhibit 5: Progress on portfolio themes in 2019 and 2020
Theme |
Portfolio item |
December 2018 |
December 2019 |
December 2020 |
|
1 |
Macro and political risk |
Frontier markets |
12% |
9% |
7% |
2 |
Sector diversity |
Consumer |
81% |
72% |
64% |
Technology |
5% |
11% |
20% |
||
Healthcare |
14% |
17% |
16% |
||
3 |
Ownership and governance |
Family or founder-controlled companies |
53% |
63% |
76% |
4 |
Portfolio concentration |
Number of holdings in the portfolio |
45 |
36 |
38 |
Source: Fundsmith, Edison Investment Research at end-December 2020
Exhibit 6: Progress on portfolio themes in 2019 and 2020 |
Source: Fundsmith, Edison Investment Research at end-December 2020 |
Exhibit 7 presents the portfolio by geography. Portfolio restructuring has resulted in a 4.6pp reduction of frontier markets exposure to 4.8% (at 31 December 2020), although they are still the third largest position geographically. The managers did not deliberately reduce their frontier markets exposure but sold out of companies with perceived weaker business models, and with a lesser ability to produce sustained investment returns due to the regulatory or macroeconomic risks of the countries in which they operate. India and China (including Hong Kong) remain in the top two positions, at 42.9% and 16.2%, respectively (at 31 December 2020). The managers sold two of their three South African holdings, Tiger Brands and Mr Price. Argentinian holdings were topped up by 4.3pp, while Egypt reduced by 3.4pp. Brazil’s weighting has increased 1.2pp to 4.8%.
The team primarily sold holdings in companies operating in macro and legislative environments perceived to be overly risky (even over the long term). Large currency swings, alongside the risk of potential post COVID-19 government levies over industries such as alcohol, beverages and tobacco, prompted the team to exit the exposed businesses. FEET’s exposure to these more challenged countries, including Sri Lanka, Bangladesh, Pakistan, Ghana, Nigeria, South Africa and Indonesia, has shrunk to five from 15 stocks over time. The portfolio remains radically different from the MSCI Emerging & Frontier Markets Index (Exhibit 7), as the index is not a consideration for the managers when building FEET’s portfolio. India is the largest overweight at 33.7pp, while China & Hong Kong is the largest underweight at -22.5pp. The geographic split, including being heavy in India and relatively light in China, reflects the identified IU and the manager’s bottom-up investment approach and stock selection. South Korea (index weight of 13.3%) is zero-weighted in the portfolio. The team has initiated a position in Taiwan (index weight 12.6%).
Exhibit 7: Portfolio split by geography (% unless stated) at end-December 2020
Country/region |
Portfolio weight 31 December 2020 |
Portfolio weight 31 December 2019 |
Change (pp) |
Benchmark 31 December 2020 |
Active weight vs index (pp) |
Trust/index |
India |
42.9 |
41.4 |
1.5 |
9.2 |
33.7 |
4.7 |
China & Hong King |
16.2 |
15.5 |
0.7 |
38.7 |
(22.5) |
0.4 |
Other Emerging Markets |
9.1 |
9.6 |
(0.5) |
14.0 |
(2.1) |
0.9 |
Argentina |
9.0 |
4.7 |
4.3 |
0.0 |
9.0 |
N/A |
Brazil |
4.8 |
3.6 |
1.2 |
5.1 |
(0.3) |
N/A |
Egypt |
4.8 |
9.4 |
(4.6) |
0.0 |
4.7 |
N/A |
Frontier Markets |
4.7 |
8.1 |
(3.4) |
7.1 |
(2.3) |
N/A |
Taiwan |
2.8 |
0.0 |
2.8 |
0.0 |
2.6 |
N/A |
Vietnam |
2.6 |
0.0 |
2.6 |
12.6 |
(12.6) |
0.0 |
South Korea |
0.0 |
0.0 |
0.0 |
13.3 |
(13.3) |
0.0 |
Philippines |
0.0 |
3.8 |
(3.8) |
0.0 |
0.0 |
|
Cash |
3.1 |
3.9 |
(0.8) |
0.0 |
3.1 |
N/A |
Total including cash |
100.0 |
100.0 |
|
100.0 |
|
|
Source: Fundsmith, Edison Investment Research. Note: end-December 2020 numbers are used, as provided by Fundsmith.
The active share is currently 93.7% (at 31 December 2020), slightly down from c 99% prior to the portfolio restructuring. The team continues to analyse some of the index constituents to see whether they develop into businesses they would be comfortable to invest in. The percentage overlap of the index with the IU is currently 13.3%, so the active share is likely to remain over 90%.
This high active share is better understood when looking at the sector split. Exhibits 8 and 9 present the split by Global Industry Classification Standard (GICS – MSCI classifications) and FEET’s defined sectors. FEET’s sector split reveals that the portfolio is concentrated within five key segments, fairly equally spread and together comprising 86% of the portfolio. These are food & beverage (25.3%), information technology (20.6%), healthcare (15.6%), fast-moving consumer goods (FMCG) (12.5%) and retail (12.1%). The team believes that categorising FEET’s sector exposure in this way allows investors to better understand the strategy and its sector/business diversification, compared to using GICS classification, where c 54% of the fund would be classified as consumer staples.
Exhibit 8: Portfolio breakdown by FEET sector* |
Exhibit 9: Portfolio breakdown by GICS sector |
Source: Fundsmith, Edison Investment Research. Note: Data at 31 December 2020, rebased for cash. *Based on the sector split by FEET’s team |
Exhibit 8: Portfolio breakdown by FEET sector* |
|
Exhibit 9: Portfolio breakdown by GICS sector |
|
Source: Fundsmith, Edison Investment Research. Note: Data at 31 December 2020, rebased for cash. *Based on the sector split by FEET’s team |
One of the top portfolio holdings is MercadoLibre (9.0% of the portfolio at 31 December 2020), the largest online retailer and payments business in Latin America, with a market cap of c $86bn, operating in 18 countries. Its compound revenue growth over the past five years is 37% (at September 2020). The team sees further growth potential in this retail business, as online penetration in the region grows from still-low levels. Around 5% of overall retail sales in both Mexico and Brazil are carried out online, compared with c 15% in the US and 23% in China. MercadoLibre uses cash generated by its e-commerce arm to invest into other growing business segments with high return potential. The company’s payments business serves digital sellers and also bricks-and-mortar stores. The FEET team expects to compound returns as MercadoLibre expands.
Another top 10 holding is Foshan Haitian Flavouring and Food company (8.0%), which produces and sells flavourings and food products in China. It provides soy sauce, oyster sauce, paste, vinegar, cooking wine, granulated chicken bouillon, fermented bean curd, seasoning extract, chicken powder seasoning, sesame oil, monosodium glutamate, pickle and grain products, as well as drinks and gift boxes. The company also exports its products to approximately 60 countries and regions worldwide. The FEET team expects high-paced growth and development as the company expands its product reach and offering within China and internationally.
Nestlé India (3.7%) is India’s largest standalone food company. The team describes it as a locally managed strong and growing business. Over the past 20 years its compound revenue growth rate has been around 12% pa. The company is a market leader for c 80% of the products in its portfolio, including everyday items such as noodles, instant coffee and infant cereals, with over 50% market share in all these segments. The team expects further nutritional product launches to contribute materially to the business’s growth and development, as increasingly sophisticated Indian consumers turn to quality-assured brands for their everyday food items. The company has around 200 million direct online consumers and around 40 million new consumers are added each year.
Looking at the ROCE of FEET’s top 10 holdings versus the top 10 constituents of the index (Exhibit 10), the superiority of ROCE of FEET’s investee companies is clear. The average ROCE of FEET’s top 10 holdings of 43% (31 December 2020) compares to an average of 10% for the 10 largest stocks in the index.
Exhibit 10: FEET’s top 10 holdings vs. MSCI EM top 10 constituents and their ROCE*
FEET Top 10 Company |
Country |
Industry (GICS) |
Portfolio weight % |
ROCE %
|
Top 10 MSCI EM constituents Company |
Country |
Industry (GICS) |
Index weight |
ROCE %
|
31-Dec-20 |
31-Dec-20 |
||||||||
Mercadolibre |
US (Argentina) |
Consumer discretionary |
9.0 |
N/M** |
TSMC |
Taiwan |
Information technology |
5.8 |
27 |
Foshan Haitian |
China |
Consumer staples |
8.0 |
45 |
Alibaba |
China |
Consumer discretionary |
5.5 |
9 |
Asian Paints |
India |
Materials |
4.9 |
30 |
Tencent |
China |
Communication services |
5.3 |
18 |
Info Edge |
India |
Communication services |
4.7 |
15 |
Samsung Electronics |
South Korea |
Information technology |
4.5 |
11 |
Vitasoy |
Hong Kong |
Consumer staples |
4.4 |
24 |
Meituan Dianping |
China |
Consumer discretionary |
1.7 |
8 |
Havells |
India |
Industrials |
3.8 |
18 |
Naspers |
South Africa |
Communication services |
1.1 |
-2 |
Nestlé India |
India |
Consumer staples |
3.7 |
88 |
Reliance Industries |
India |
Energy |
1 |
10 |
Avenue Supermarkets |
India |
Consumer discretionary |
3.3 |
20 |
JD.com |
China |
Consumer discretionary |
1 |
8 |
Hindustan Unilever |
India |
Consumer staples |
3.3 |
109 |
China Construction Bank |
China |
Financials |
0.9 |
5 |
Metropolis Healthcare |
India |
Healthcare |
3.2 |
40 |
Ping An Insurance |
China |
Financials |
0.9 |
3 |
Top 10 (% of holdings) |
48.3 |
N/A |
27.7 |
N/A |
|||||
Average |
N/A |
43 |
N/A |
10 |
Source: Fundsmith Emerging Equities, Edison Investment Research, Bloomberg, MSCI. Note: *ROCE=return on capital employed; **NM – not measurable. End-December 2020 numbers are used, as provided by Fundsmith.
Since shortly after the trust’s launch, India has been and remains the largest overweight position (+33.7pp at end-December 2020) relative to the index. Seven of the top 10 holdings are Indian companies. Following the application of its four-factor analytical framework of quality, growth, predictability and sustainability of returns, the team concluded that India has a large number of some of the best companies to fit the fund’s remit. For example, the difficult operating environment, such as hard-to-set-up distribution and logistics channels, give established Indian businesses a strong competitive advantage.
The team considers the growth of e-commerce channels as a major opportunity for most portfolio companies, to enable them to grow, develop and maintain high ROCE. During the last few years, the team has reduced the number of listed FMCG companies in the portfolio, where it felt they had limited growth and return potential. Many of these were high return businesses, but in the team’s view lacked the scope for growth. Often they were replaced with businesses in sectors outside the fund’s traditional FMCG space (such as healthcare and technology), as there are far more of these businesses available for inclusion in the fund’s IU than there were in the early days of the fund, particularly those with highly developed e-commerce channels.
Following the sharp stock market corrections in March 2020, the team initiated four holdings, three in technology (XP Inc, Tencent and Taiwan Semiconductor (TSMC, bought in Q420) and one in the retail space (Lojas Renner). Two of those were acquired after material share price falls, with Tencent experiencing a more modest decline. Three were businesses familiar to the team for the last few years, while XP Inc was a 2019 IPO.
XP Inc, a business that was listed in late 2019, is the largest online investment platform for retail investors in Brazil and has a 4.5% share of the $2.1tn investment market in the country. XP has more than 1.5m retail clients on its platform (0.6% of Brazil’s population) who can invest in equity, fixed income and mutual funds. XP is 10 times larger than its nearest independent competitor in a market that is dominated by banks, and is aiming to grow its market share up to 25% between now and 2024. Only 10% of retail investment assets in Brazil are in equities, giving the group scope for growth, and the penetration level of brokerage accounts (c 1.0%) is well below that of the developed world.
Taking advantage of a sharp share price fall, the second new holding for FEET was Lojas Renner. Lojas Renner is the largest fashion retailer in Brazil, with over 600 stores. The team believes that the strength of its brand, online business and other competitive advantages will result in robust long-term growth, despite the challenging economic environment caused by COVID-19 disruptions and lockdowns. Barriers to entry are provided by a combination of consistent execution and investment in physical and digital infrastructure, all of which discourage international entrants. Efficiency is helped by having most of its supply chain within Brazil.
The third new holding, Tencent, is China’s largest social networking, gaming and music streaming company. Its social media platform (WeChat) has over 1.2 billion users, while its QQ messaging service has over 600 million users. Around the WeChat infrastructure are a number of other services such as payments, utilities, gaming, information and news. Some 98% of Chinese internet users access the internet through smartphones, supporting Tencent’s business model, which has focused on building a large user base with relatively low transaction values and a high proportion of revenues derived from subscriptions. Foreign entrants into the market are highly restricted by Chinese law. Tencent also has a strategic investment portfolio of considerable value.
The team considers TSMC – its first Taiwanese investment – as one of the best businesses it has ever come across. TSMC is the world’s largest semiconductor contract manufacturer with a market share of over 50%, which is expanding further. The managers highlight TSMC’s leading industry position, which is now an effective duopoly. It has focused on developing its own technologies in both products and the manufacturing process and has been successful in winning clients with its proposition. American and Japanese rivals have ceased developing the smaller chip sizes that TSMC manufactures and the managers believe China is several years behind in technology and implementation.
The managers believe the businesses of these new acquisitions will benefit from the trends that the COVID-19 pandemic is likely to accelerate, namely consolidation, formalisation and digitalisation. Exhibit 11 illustrates the portfolio’s large exposure to all three trends.
Exhibit 11: FEET top 15 holdings split by key investment themes
Consolidation |
Formalisation |
Digitalisation |
|
Mercadolibre |
+ |
||
Foshan Haitian |
+ |
+ |
|
Asian Paints |
+ |
+ |
|
Info Edge |
+ |
+ |
+ |
Vitasoy |
+ |
+ |
|
Havells |
+ |
+ |
+ |
Nestlé India |
+ |
+ |
|
Avenue Supermarts |
+ |
+ |
+ |
Hindustan Unilever |
+ |
+ |
+ |
Metropolis Healthcare |
+ |
+ |
+ |
Marico |
+ |
+ |
|
Dr Lal Pathlabs |
+ |
+ |
|
Vietnam Dairy |
+ |
+ |
|
Philippine Seven |
+ |
+ |
+ |
Godrej Consumer Products |
+ |
+ |
Source: Fundsmith at December 2020
Outside these purchases, the portfolio has seen little stock turnover in the year-to-date. The team exited only two stocks: Tiger Brands, a South African business, and TravelSky, a Chinese travel operator. The team initiated a position in TravelSky in 2017 as air passenger traffic was rapidly growing in China. At the time of investment, TravelSky enjoyed a government-enforced monopoly position and was a state-owned enterprise, with a combination of China’s central government and state-controlled airlines having majority control. The fund managers’ decision to exit the position in part reflected TravelSky allocating capital outside of the business, most notably setting up joint ventures in the insurance and telecom sectors.
The investment case for Tiger Brands was no longer there for O’Brien, as he believed the company’s management had lost their grip on the business. Also, the manager trimmed a few holdings of companies exposed to those countries that the team does not expect to recover in the short term from the adverse impact of reduced foreign worker remittances into the countries of operation, particularly in Asia.
Performance: Back to outperformance
The fund’s net asset value (NAV) has outperformed the MSCI EM & Frontier Index in two years of the last three, including FY20 (Exhibit 12).
Exhibit 12: Five-year discrete performance data
12 months ending |
Share price* |
NAV* |
MSCI EM & Frontier |
MSCI World |
CBOE UK All Companies |
31/12/16 |
10.5 |
12.0 |
32.9 |
29.4 |
16.5 |
31/12/17 |
24.5 |
21.3 |
25.7 |
13.8 |
14.0 |
31/12/18 |
(9.4) |
(3.1) |
(9.0) |
(3.3) |
(9.8) |
31/12/19 |
(7.4) |
(0.5) |
14.3 |
22.4 |
19.3 |
31/12/20 |
29.1 |
20.7 |
14.7 |
13.2 |
(10.9) |
Source: Refinitiv. *Note: All % on a total return basis in pounds sterling.
Exhibit 13 illustrates that the managers have turned performance around with both NAV and share price outperforming the MSCI EM & Frontier Index over one year on a total return basis. This compares to the period of the last few years when ETF flows dominated the bull market, boosting the EM indices’ performance, and FEET’s NAV lagged the MSCI EM & Frontier Index.
Exhibit 13: Investment trust performance to 31 December 2020 |
|
Price, NAV and index total return performance, one-year rebased |
Price, NAV and index total return performance (%) |
Source: Refinitiv, Edison Investment Research. Note: Three-, five- and 10-year performance figures annualised. |
Having studied the index’s performance, the FEET team concluded that the index is dominated by exchange traded fund (ETF) investment flows, which usually hit the relative performance of active funds in periods of sustained ETF inflows.
According to Fundsmith, 2020 saw modest net inflows into EM by way of active funds in contrast to ETFs and index funds, which saw net outflows. In 2019, EM experienced net outflows of $17.7bn led by net outflows of $31.7bn from ‘active’ funds and $14bn net inflows into ETFs. These ETF inflows are typically invested in the largest index constituents (shown in Exhibit 10), where FEET is invested to a very small extent (its overlap with the index was 6.3% at 31 December 2020). As we highlight in the Market outlook section, three large-cap stocks – Alibaba, Meituan and Tencent (with only Tencent present in the portfolio during 2020) – were responsible for nearly 90% of China’s outperformance this year, and China, where FEET is underweight, is responsible for the strongest performance within EM since the late March low point. Heavily featured in the index, Taiwan and South Korea also performed positively.
Rather than attempting to chase the performance of the EM equity market index, FEET’s managers have chosen to focus on owning a number of high-quality companies found in a limited range of consumer-focused sectors. This is something they will not change regardless of the level of momentum in the market. The investment team believes that its disciplined approach and the quality of the holdings will result in superior relative and attractive absolute total returns over the cycle, regardless of short-term market exuberance.
Exhibit 14 demonstrates the differentiation benefits of FEET for global investors. While performance against the MSCI EM & Frontier Index has been challenging due to heavy underweights of the majority of the index stocks that performed strongly (for example tech stocks in China), the trust’s NAV has outperformed the UK equity market, and more recently during 2020, the global equity market and its benchmark as well, on a total return basis.
Exhibit 14: Share price and NAV total return relative performance
One month |
Three months |
Six months |
One year |
Three years |
Five years |
|
Price relative to MSCI EM & Frontier |
5.8 |
10.4 |
8.4 |
12.5 |
(9.4) |
(25.4) |
NAV relative to MSCI EM & Frontier |
0.9 |
(1.4) |
(2.5) |
5.2 |
(2.5) |
(20.8) |
Price relative to MSCI AC World |
8.6 |
15.1 |
14.5 |
14.0 |
(19.3) |
(24.6) |
NAV relative to MSCI AC World |
3.5 |
2.7 |
3.0 |
6.6 |
(13.1) |
(19.9) |
Price relative to CBOE UK All Companies |
7.1 |
10.7 |
18.3 |
44.8 |
12.9 |
16.9 |
NAV relative to CBOE UK All Companies |
2.1 |
(1.2) |
6.4 |
35.4 |
21.5 |
24.2 |
Source: Refinitiv, Edison Investment Research. Note: Data to end-December 2020. Geometric calculation.
Exhibit 15: NAV total return performance relative to MSCI EM & Frontier index over one year |
Source: Refinitiv, Edison Investment Research. |
Capital structure, fees and continuation of the company
FEET has one share class, with 26.6m ordinary shares currently in issue. During H120 no shares were issued (0.25m shares were issued during FY19, raising proceeds of £3m). FEET bought back c 0.04m shares for total consideration of £0.045m during H220. During H120 and FY19 FEET did not buy back any shares. The trust is subject to the board’s proposal of a conditional continuation vote. If the shares trade on average at a discount in excess of 10% of the NAV per ordinary share during a financial year, the board can propose a special discontinuation resolution at the AGM following that financial year.
Gearing is permitted up to 15% of net assets. The managers have not historically used gearing in the day-to-day management of the fund. The company can borrow using short-term banking facilities to raise funds for short-term liquidity purposes or for discount management, including the purchase of its own shares.
With effect from 31 May 2019, the annual management fee was reduced from 1.25% to 1.00% of the company’s NAV. The fee is paid from the revenue account. No performance fee is charged. Ongoing charges were 1.30% at 30 June 2020, down from 1.40% at 30 June 2019.
Dividend policy and record
The company’s principal objective remains to provide shareholder returns through capital growth in its investments rather than income, and the board’s current policy is to pay dividends only to the extent required to maintain UK investment trust status. From launch to FY17 inclusive, the company allocated all of its expenses against its income account and paid no dividends. In future, more expenses are expected to be allocated against capital, and the trust will distribute dividends at the board’s discretion.
In FY19 the company paid a 3.2p per share total dividend, 60% up on the previous year (2.0p in FY18). These were paid in June of their respective years as a final dividend. The FY19 gross revenue return per share was 26p per share. After payment of the final FY19 dividend of 3.2p per share in June 2020, revenue reserves represented 2x cover of the full year’s dividend.
Peer group comparison
Exhibit 17 shows the AIC Global Emerging Markets sector peer group for funds with market capitalisations over £100m. We have also included the smaller Jupiter Emerging & Frontier Income Trust, as its mandate includes frontier markets. The funds within the sector are diverse, including those specialising in frontier markets, income and infrastructure; therefore, direct comparisons should be treated with caution.
The market has reflected the transition in FEET’s relative performance; the fund currently has the narrowest discount within the peer group.
FEET’s NAV total return performance and ranking have improved over the past year. The trust outperformed the peer group average over one year by 10.6pp and performed in line with selected peers over three years. It underperformed over five years by 31.3pp. It ranks second of nine (top quartile) over one year, and sixth over three and five years.
Exhibit 17: AIC Global Emerging Markets sector selected peer group as at 31 December 2020*
% unless stated |
Market cap (£m) |
NAV TR |
NAV TR |
NAV TR |
NAV TR |
Discount (cum-fair) |
Ongoing charge |
Perf. |
Net gearing |
Dividend yield (%) |
Fundsmith Emerging Equities Trust |
399.1 |
20.7 |
16.4 |
58.1 |
N/A |
(2.4) |
1.4 |
No |
100 |
0.2 |
Aberdeen Emerging Markets |
334.4 |
18.1 |
21.1 |
92.3 |
59.4 |
(13.7) |
1.1 |
No |
102 |
0.0 |
BlackRock Frontiers |
291.9 |
0.1 |
(8.9) |
40.5 |
N/A |
(2.6) |
1.4 |
Yes |
109 |
4.3 |
Genesis Emerging Markets |
1,112.6 |
13.1 |
24.8 |
100.7 |
78.2 |
(10.0) |
1.1 |
No |
99 |
1.4 |
JPMorgan Emerging Markets |
1,683.9 |
23.1 |
41.3 |
134.6 |
122.7 |
(2.9) |
0.9 |
No |
100 |
1.0 |
JPMorgan Global Emerg Mkts Income |
460.0 |
10.5 |
22.5 |
103.4 |
97.0 |
(3.8) |
1.2 |
No |
106 |
3.3 |
Jupiter Emerging & Frontier Income |
90.2 |
0.3 |
6.9 |
N/A |
N/A |
(4.6) |
1.4 |
No |
110 |
4.2 |
Templeton Emerging Mkts (TEMIT) |
2,383.4 |
15.7 |
27.1 |
147.9 |
71.2 |
(11.8) |
1.0 |
No |
100 |
1.9 |
Utilico Emerging Markets |
441.1 |
(10.7) |
(3.5) |
37.9 |
68.3 |
(13.1) |
1.1 |
Yes |
110 |
3.8 |
Average |
799.6 |
10.1 |
16.4 |
89.4 |
82.8 |
(7.2) |
1.2 |
104 |
2.2 |
|
FEET Rank |
6 |
2 |
6 |
6 |
N/A |
1 |
2 |
6 |
8 |
|
Count |
9 |
9 |
9 |
8 |
6 |
9 |
9 |
2 / 9 |
9 |
9 |
Source: Morningstar, Edison Investment Research. Note: *Performance as at 31 December 2020. TR = total return. Net gearing is total assets less cash and equivalents as a percentage of net assets.
We have also plotted FEET’s performance relative to selected Asia-Pacific funds with sizeable Indian and China/Hong Kong exposure in Exhibits 18 and 19. FEET stands out among pure India trusts over all time periods and also among the selected Asia-Pacific funds over one and three years, ranking second top. FEET ranks second top the selected Asia-Pacific peers over one year, despite its exposure to the top performing China/Hong Kong market is less than that in the comparable four funds. FEET’s relatively weak performance over five years is primarily due to previously higher exposure to a number of underperforming frontier markets stocks, now exited.
Exhibit 18: Peers – India trusts as at 31 December 2020*
% unless stated |
Market cap (£m) |
NAV TR |
NAV TR |
NAV TR |
NAV TR |
Discount (cum-fair) |
Ongoing charge |
Perf. |
Net gearing |
Dividend yield (%) |
Fundsmith Emerging Equities Trust |
399.1 |
20.7 |
16.4 |
58.1 |
N/A |
(2.4) |
1.4 |
No |
100 |
0.2 |
Aberdeen New India Ord |
320.0 |
13.2 |
14.6 |
71.1 |
110.4 |
(11.1) |
1.1 |
No |
110 |
0.1 |
Ashoka India Equity Investment Ord |
99.3 |
26.0 |
|
|
|
3.0 |
0.9 |
Yes |
109 |
0.0 |
India Capital Growth Ord |
97.4 |
10.8 |
(22.8) |
N/A |
N/A |
(14.7) |
1.9 |
No |
99 |
0.0 |
JPMorgan Indian Ord |
560.7 |
1.2 |
(7.5) |
38.1 |
54.9 |
(13.2) |
1.0 |
No |
101 |
0.0 |
Average |
295.3 |
14.4 |
0.2 |
55.8 |
82.7 |
(7.7) |
1.2 |
104 |
0.1 |
|
FEET Rank |
2 |
2 |
1 |
2 |
N/A |
2 |
2 |
4 |
1 |
|
Count |
5 |
5 |
4 |
3 |
2 |
5 |
5 |
1 / 5 |
5 |
5 |
Source: Morningstar, Edison Investment Research. Note: *Performance as at 31 December 2020. TR = total return. Net gearing is total assets less cash and equivalents as a percentage of net assets.
Exhibit 19: Peers – Asia Pacific funds with sizeable Indian and China/HK exposure as at 31 December 2020*
% unless stated |
Market cap (£m) |
NAV TR |
NAV TR |
NAV TR |
NAV TR |
Discount (cum-fair) |
Ongoing charge |
Perf. |
Net gearing |
Dividend yield (%) |
Fundsmith Emerging Equities Trust |
399.1 |
20.7 |
16.4 |
58.1 |
N/A |
(2.4) |
1.4 |
No |
100 |
0.2 |
Pacific Assets Ord |
419.7 |
20.8 |
30.0 |
83.2 |
171.0 |
(4.3) |
1.2 |
No |
98 |
0.9 |
Fidelity Asian Values Ord |
331.9 |
11.9 |
13.0 |
71.2 |
N/A |
(0.1) |
1.0 |
Yes |
100 |
1.9 |
Scottish Oriental Smaller Cos Ord |
278.6 |
3.5 |
(2.5) |
39.7 |
96.7 |
(14.0) |
1.0 |
Yes |
98 |
0.1 |
Mobius Investment Trust Ord |
121.3 |
17.6 |
|
|
|
(4.2) |
1.7 |
No |
95 |
0.0 |
Average |
310.1 |
14.9 |
14.2 |
63.1 |
133.8 |
(5.0) |
1.3 |
98 |
0.6 |
|
FEET Rank |
2 |
2 |
2 |
3 |
N/A |
2 |
2 |
2 |
3 |
|
Count |
5 |
5 |
4 |
4 |
2 |
5 |
5 |
2 / 5 |
5 |
5 |
Source: Morningstar, Edison Investment Research. Note: *Performance as at 31 December 2020. TR = total return. Net gearing is total assets less cash and equivalents as a percentage of net assets.
FEET is a growth-focused mandate (reflected by 0.2% dividend yield) and it does not charge a performance fee.
The board
FEET’s board currently has four directors, all of whom are non-executive and independent of the manager. The board members are: Chairman Martin Bralsford (appointed in 2014, chairman since launch); Rachel de Gruchy (appointed in 2018); David Potter, chairman of the management engagement committee and senior independent director (appointed in 2014); and John Spencer, chairman of the audit committee (appointed in 2014).
|
|
Research: TMT
YouGov’s pre-close update indicates trading in line to meet the full-year target of its growth plan, with a heavier weighting towards H2. This reflects several larger, more strategic projects won by Data Products and Custom Research over autumn and winter to date, which will start to contribute in H221 and provide good momentum into FY22. H121 results will show a pick-up in Data Services as clients looked to tactical projects to inform their marketing strategies. Our full-year forecasts are unchanged except for a minor adjustment to the share count. YouGov is valued towards the top of its peer set, reflecting its strong market positioning, attractive cash generation and cash-positive balance sheet.
Get access to the very latest content matched to your personal investment style.